Bar
Overview
The bar insight type is used to display data as bars.
You have broad control over the appearance of bars via the marker attributes. You can set the fill color, opacity, pattern, line color, width, etc. You can also configure bars to display as either grouped or stacked.
Common Uses
- Categorical Data Comparison: Visualizing data across distinct categories (e.g., sales by product type).
- Grouped Bar Charts: Comparing multiple series side by side (e.g., monthly sales by region).
- Stacked Bar Charts: Showing cumulative data (e.g., revenue breakdown by product within a year).
- Horizontal Bar Charts: Comparing data where horizontal labels are more readable (e.g., ranking of countries by population).
- Time-Series Data (Categorical): Displaying data changes over time with categories as the x-axis (e.g., yearly revenue growth by product).
See the Attributes for the full set of configuration options.
Examples
Common Configurations
Here's a really simple bar chart:
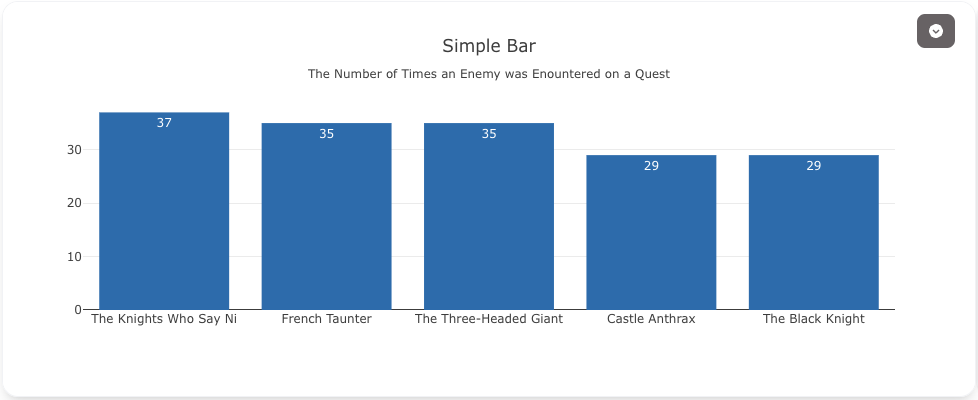
sources:
  - name: monty-python-quest-data-source
    type: duckdb
    database: target/seeds/monty_python_quest_data.duckdb
    seeds:
      - table_name: model
        args:
          - curl
          - "https://raw.githubusercontent.com/visivo-io/data/refs/heads/main/monty_python_quests.csv"

models:
  - name: monty-python-quest-data
    source: ${ref(monty-python-quest-data-source)}
    sql: select * from model
insights:
  - name: Count Enemies Encountered by Knight
    props:
      type: bar
      x: ?{${ref(monty-python-quest-data).enemy_encountered}}
      y: ?{count(*)}
      text: ?{count(*)}
    interactions:
      - sort: ?{ count(*) DESC }

charts:
  - name: Count Times Enemy Was Encountered by Knight
    insights:
      - ${ref(Count Enemies Encountered by Knight)}
    layout:
      title:
        text: Bar<br><sub>The Number of Times an Enemy was Encountered on a Quest</sub>
Use the interactions.split key to create facets in your bar chart.
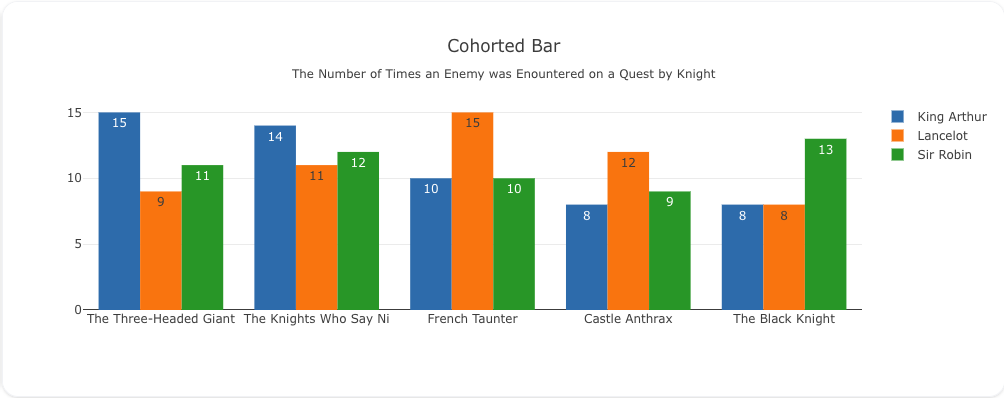
sources:
  - name: monty-python-quest-data-source
    type: duckdb
    database: target/seeds/monty_python_quest_data.duckdb
    seeds:
      - table_name: model
        args:
          - curl
          - "https://raw.githubusercontent.com/visivo-io/data/refs/heads/main/monty_python_quests.csv"

models:
  - name: monty-python-quest-data
    source: ${ref(monty-python-quest-data-source)}
    sql: select * from model
insights:
  - name: Count Enemies Encountered by Knight
    props:
      type: bar
      x: ?{${ref(monty-python-quest-data).enemy_encountered}}
      y: ?{count(*)}
      text: ?{count(*)}
    interactions:
      - split: ?{ person }
      - sort: ?{ count(*) DESC }

charts:
  - name: Count Times Enemy Was Encountered by Knight
    insights:
      - ${ref(Count Enemies Encountered by Knight)}
    layout:
      title:
        text: Split Bar<br><sub>The Number of Times an Enemy was Encountered on a Quest by Knight</sub>
Sometimes it’s useful to view data horizontally.
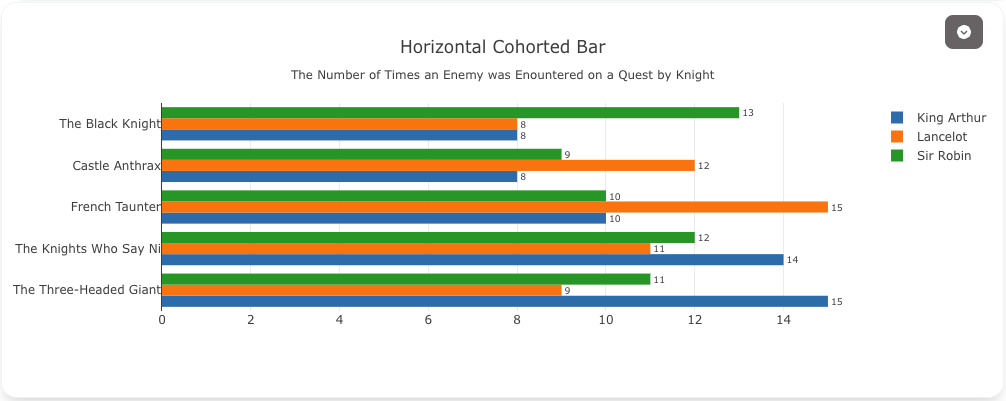
sources:
  - name: monty-python-quest-data-h-source
    type: duckdb
    database: target/seeds/monty_python_quest_data_h.duckdb
    seeds:
      - table_name: model
        args:
          - curl
          - "https://raw.githubusercontent.com/visivo-io/data/refs/heads/main/monty_python_quests.csv"

models:
  - name: monty-python-quest-data-h
    source: ${ref(monty-python-quest-data-h-source)}
    sql: select * from model
insights:
  - name: Count Enemies Encountered by Knight H
    props:
      type: bar
      x: ?{${ref(monty-python-quest-data-h).enemy_encountered}}
      y: ?{count(*)}
      text: ?{count(*)}
      textposition: outside
      textfont:
        size: 15
      orientation: h
    interactions:
      - split: ?{ person }
      - sort: ?{ count(*) DESC }

charts:
  - name: Count Times Enemy Was Encountered by Knight H
    insights:
      - ${ref(Count Enemies Encountered by Knight H)}
    layout:
      title:
        text: Horizontal Split Bar<br><sub>The Number of Times an Enemy was Encountered on a Quest by Knight</sub>
      margin:
        l: 160