Quick Start
🚀 Data to Dashboard in 90 Seconds
Visivo is BI-as-code: your dashboards are YAML you can read, diff, and review. The fastest way to see what that looks like is to start from an example that already works.
1. Install Visivo
curl -fsSL https://visivo.sh | bash
The script installs the visivo binary to ~/.visivo/bin and adds it to your PATH. On Windows, run it inside WSL, or use the pip installation instead.
The installer requires macOS 15 or later
On macOS the script checks sw_vers -productVersion before it downloads anything, and exits with Error: macOS version <yours> is not supported. Requires macOS 15 or later. on anything older. There is no flag to override it — install with pip instead on macOS 14 and below. Linux needs x86_64; Apple Silicon and Intel Macs are both covered.
Confirm it landed:
visivo --version
2. Start From a Bundled Example
visivo init --example ev-sales
That single command:
- Copies the
ev-salessample into the current directory — aproject.visivo.yml, the DuckDB file it queries, and the CSV that data came from. - Names the project after the directory you ran it in.
- Parses and validates the YAML — a syntax error stops you here, at the command line.
- Starts the dev server at
http://localhost:8000. - Then compiles and runs every model and insight query. The build runs after the server is already listening, not before, so the terminal is your progress bar: wait for
Initial Data Refresh Complete. - Opens your browser at
http://localhost:8000/?onboarding=1.
Your browser opens on the onboarding wizard, not on the dashboard
That ?onboarding=1 is not decoration: the viewer redirects it to the in-browser setup wizard ("Welcome to Visivo — you will leave this 2 minute flow with a working dashboard"), even though the example already ships a source, a model, and data that just finished building. To get to the EV Sales dashboard:
- click Skip onboarding and go straight to the editor, or re-run with
visivo init --example ev-sales --no-onboardingto skip the redirect entirely; then - from the project home — a three-card chooser, not a dashboard — pick Dashboards (
http://localhost:8000/project) and open EV Sales.
The wizard exists for visivo init with no --example, where you really do have no source yet. Skip it here.
No downloads, no database to set up
The examples ship inside the Visivo package and query a small bundled DuckDB file, so this works offline and the YAML always matches the version of Visivo you just installed.
Three examples ship with the CLI:
--example value |
What it builds | Chart types it shows |
|---|---|---|
ev-sales |
Electric-vehicle units and revenue by region, powertrain, and quarter | indicator, bar, pie |
github-releases |
Release counts, downloads over time, and contributors per repo | indicator, bar, scatter |
college-football |
2024 game scores and attendance by team and conference | indicator, bar, box |
Each one is deliberately small — one source, one model, five insights, five charts, one dashboard — so you can read the whole file in a couple of minutes.
Useful init flags
--bare— write the project files and stop, without launching the dev server.--headless— start the dev server but don't open a browser.--no-onboarding— open the browser at the project home instead of the onboarding wizard.-p, --port— serve on a port other than8000.-pd, --project-dir— initialize into a subdirectory instead of the current one.
So the fully scripted version of the walkthrough is:
visivo init --example ev-sales --project-dir ev-demo --bare
cd ev-demo
visivo run     # build the data once
visivo serve   # then watch and hot-reload; prints the URL to open
3. Read the Project
Open project.visivo.yml. Every Visivo project is the same five-object chain, and the example is a complete, working instance of it. Below is that chain trimmed to one insight and one chart so it fits on a screen — the file you just installed carries five of each, wired the same way:
name: ev-demo

sources:
  # Where the data lives.
  - name: ev_sales_db
    type: duckdb
    database: ev_sales.duckdb

defaults:
  source_name: ev_sales_db

models:
  # A named SQL query against that source.
  - name: ev_sales
    sql: SELECT * FROM ev_sales

insights:
  # A chart definition, written against the model's columns.
  - name: units_by_quarter
    props:
      type: bar
      x: ?{ ${ref(ev_sales).quarter} }
      y: ?{ SUM(${ref(ev_sales).units_sold}) }
    interactions:
      - sort: ?{ ${ref(ev_sales).quarter} ASC }

charts:
  # A chart wraps one or more insights and owns the Plotly layout.
  - name: units_by_quarter_chart
    insights:
      - ${ref(units_by_quarter)}
    layout:
      title:
        text: "EV units sold by quarter"

dashboards:
  # Rows of items place the charts on a page.
  - name: EV Sales
    rows:
      - height: medium
        items:
          - chart: ${ref(units_by_quarter_chart)}
A dashboard item takes a chart, not an insight
A dashboard item holds a chart, table, markdown, or input (plus rows, path, and file_path for composition) — never a bare insight. The Item model rejects unknown keys, so insight: inside a dashboard row is a validation error. Wrap insights in a chart first, exactly as above. See Insight for why charts are the wrapper, and Dashboard for the full row/item vocabulary.
4. Edit It and Watch It Reload
With the dev server running — and with the EV Sales dashboard on screen, not the onboarding wizard — find units_by_quarter_chart in project.visivo.yml and edit exactly one line, the text: under its layout.title:
- from
text: "EV units sold by quarter" - to
text: "Quarterly EV demand"
Change the line — don't replace the block
Leave the chart's insights: list where it is. Chart.insights defaults to an empty list, so a chart that lists none is perfectly valid: the project compiles, visivo run exits 0, and the dashboard item renders an empty chart with no error anywhere. The only hint you would get is No jobs run. in the terminal — which, one section down, this page tells you is normal.
Save the file (Cmd+S / Ctrl+S). That's it — no build command, no page refresh. Visivo recompiles the project and pushes the result to the open browser tab. Your terminal shows:
Server has detected changes to the project. Re-running project...
Compile completed in 0.03s imports: 0.91s, parse: 0.03s
Running project across 8 threads

No jobs run. Ensure your filter contains nodes that are runnable.
File Change Data Refresh Complete.
View your project at: http://localhost:8000
No jobs run. after a title change is the right answer
A title lives in layout, so nothing needed re-querying — the watcher recompiled, found no runnable node in the changed slice, and pushed the new title to the browser anyway. Nothing failed. Change an insight's props or a model's sql instead and the same watcher does re-run the affected queries, logging Updated data for insight ... before File Change Data Refresh Complete.
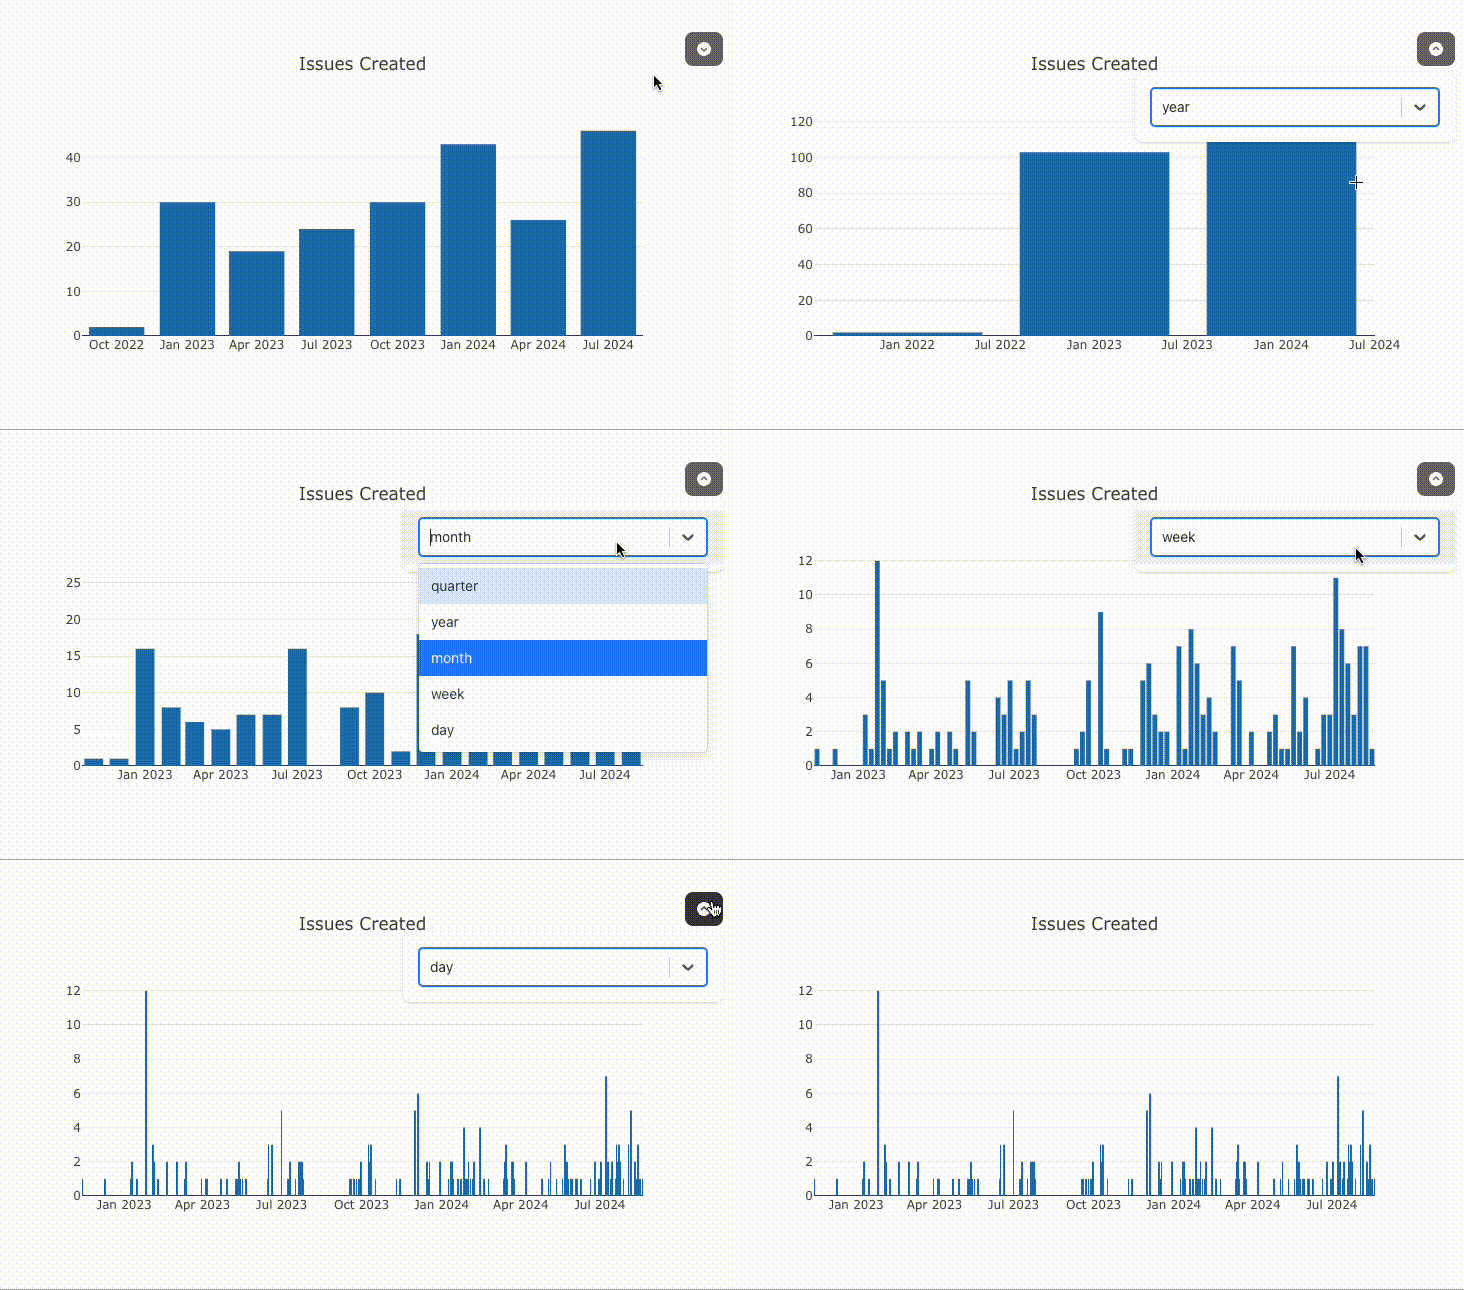
Pro Tip: Split Screen Development
Open your editor and browser side-by-side. As you type and save, watch your dashboard transform in real-time. It's like having a conversation with your data!
Starting From Scratch Instead
If you'd rather not start from an example, run init with no flags:
visivo init
This writes a project.visivo.yml scaffold of commented examples, plus a .gitignore and a .env.example if you don't already have them, and then opens the in-browser setup wizard so you can add a source without hand-writing connection details.
The scaffold is empty on purpose
Everything in the scaffold is commented out, so visivo run reports No jobs run. Ensure your filter contains nodes that are runnable. until you define a real source and model. That message is expected here — it means nothing failed, only that this run selected no runnable node. Uncomment the examples in the file, or add a source through the wizard.
The same line shows up in two other places, and it never means "something broke": after a layout-only edit in a complete project (nothing needed re-querying), and after a chart lost its insights: list (nothing is attached to build). Read it as this run had no work, then check which of the three you are in.
What visivo serve Does
visivo serve is the command for a directory that already has a project. It compiles and runs the project on launch, watches your files, and hot-reloads the browser on every save.
Run it in an empty directory, or pass --new, and it starts an empty in-memory project and opens the in-browser setup wizard. In that mode it writes no project file, and the initial build logs No jobs run. because there is nothing to build. It does not offer to install an example — that's what visivo init --example is for.
Alternative: AI-Powered Development
Want a more conversational approach? Try using AI agents like Claude Code to build your dashboard through natural language. AI can analyze your data, suggest visualizations, and write the complete configuration for you.
Explore AI-powered dashboard creation
What's Next?
Now that you have a running dashboard, explore what's possible:
-
Customize Your Dashboard
Learn how to modify layouts, rows, items, and styling
-
Add Charts & Visualizations
Explore 40+ insight types with rich customization options
-
Connect Your Data
Set up connections to your production databases
-
Make It Interactive
Add filters, splits, sorts, and dropdown inputs
-
Deploy & Share
Share your dashboards with your team
-
Every Command & Flag
The full CLI reference, generated from the code itself
Questions? Contact us - we're here to help!
Why Visivo?
"Unlike other tools that require complex setup and configuration, Visivo gets you from zero to dashboard in 90 seconds. Start from a bundled example, from a blank scaffold, or hand the YAML to an AI agent — any of the three gets you a working dashboard before your coffee gets cold."