Barpolar
Overview
The barpolar insight type is used to create bar charts in polar coordinates. This is particularly useful for displaying data that is cyclical or directional in nature, such as wind directions, time-of-day activities, or any phenomena that repeats over a circular dimension.
You have extensive control over the appearance of the bars through the marker and insidetextfont attributes. You can set colors, opacity, line styles, and more. Bars can be customized to start at a specific radial axis and extend to another, allowing for flexible representations.
Common Uses
- Wind Rose Charts: Visualizing wind speed and direction distributions.
- Circular Histograms: Displaying the frequency of events over a circular variable like time of day or compass direction.
- Directional Data Representation: Showcasing data that has a directional component (e.g., animal migration patterns).
- Cyclical Phenomena Visualization: Illustrating patterns that repeat over a cycle (e.g., seasonal sales data).
See the Attributes for the full set of configuration options.
Examples
Common Configurations
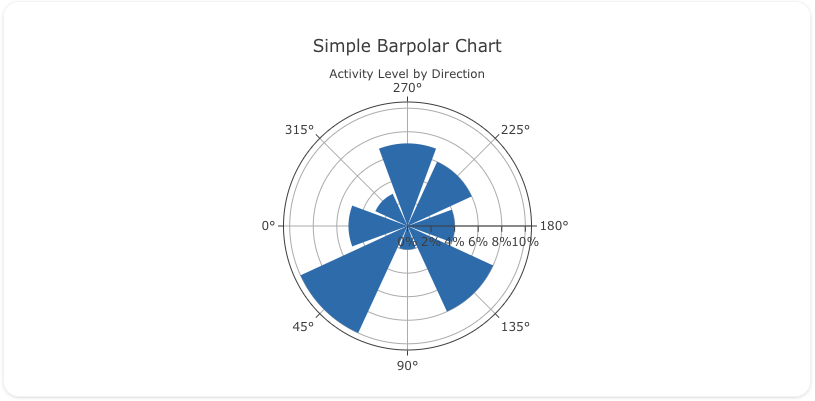
Here's a simple barpolar chart showing activities over different compass directions:
sources:
  - name: activity-data-source
    type: duckdb
    database: target/seeds/activity_data.duckdb
    seeds:
      - table_name: model
        args:
          - echo
          - |
            direction,activity_level
            0,5
            45,10
            90,2
            135,8
            180,4
            225,6
            270,7
            315,3

models:
  - name: activity-data
    source: ${ref(activity-data-source)}
    sql: select * from model
insights:
  - name: Activity Level by Direction
    props:
      type: barpolar
      r: ?{${ref(activity-data).activity_level}}
      theta: ?{${ref(activity-data).direction}}
      marker:
        color: "#1f77b4"
    interactions:
      - sort: ?{ direction }

charts:
  - name: Activity Level Polar Chart
    insights:
      - ${ref(Activity Level by Direction)}
    layout:
      polar:
        radialaxis:
          ticksuffix: "%"
          tickangle: 360
          tick0: 0
          dtick: 2
        angularaxis:
          rotation: 180
      margin:
        l: 0
        r: 0
        b: 40
      title:
        text: Simple Barpolar Chart<br><sub>Activity Level by Direction</sub>
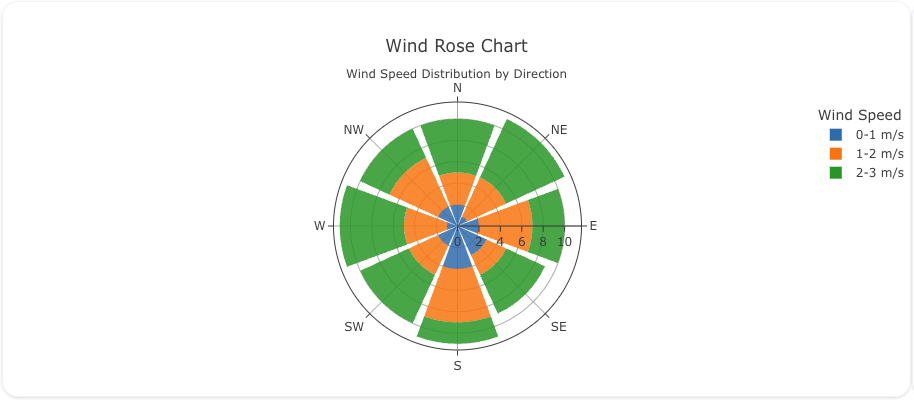
A wind rose chart is a common use of barpolar to display wind speed and direction frequencies:
sources:
  - name: wind-data-source
    type: duckdb
    database: target/seeds/wind_data.duckdb
    seeds:
      - table_name: model
        args:
          - echo
          - |
            cardinal_order,direction,speed,count
            1,N,0-1 m/s,2
            1,N,1-2 m/s,3
            1,N,2-3 m/s,5
            2,NE,0-1 m/s,1
            2,NE,1-2 m/s,4
            2,NE,2-3 m/s,6
            3,E,0-1 m/s,2
            3,E,1-2 m/s,5
            3,E,2-3 m/s,3
            4,SE,0-1 m/s,3
            4,SE,1-2 m/s,2
            4,SE,2-3 m/s,4
            5,S,0-1 m/s,4
            5,S,1-2 m/s,5
            5,S,2-3 m/s,2
            6,SW,0-1 m/s,2
            6,SW,1-2 m/s,3
            6,SW,2-3 m/s,5
            7,W,0-1 m/s,1
            7,W,1-2 m/s,4
            7,W,2-3 m/s,6
            8,NW,0-1 m/s,2
            8,NW,1-2 m/s,5
            8,NW,2-3 m/s,3

models:
  - name: wind-data
    source: ${ref(wind-data-source)}
    sql: select * from model
insights:
  - name: Wind Rose
    props:
      type: barpolar
      r: ?{${ref(wind-data).count}}
      theta: ?{${ref(wind-data).direction}}
      text: ?{${ref(wind-data).speed}}
      marker:
        color: column(bar_color)
        opacity: 0.85
      hoverinfo: "theta+r+name"
    interactions:
      - sort: ?{ cardinal_order }

charts:
  - name: Wind Rose Chart
    insights:
      - ${ref(Wind Rose)}
    layout:
      polar:
        radialaxis:
          ticksuffix: ""
          angle: 0
        angularaxis:
          direction: "clockwise"
          period: 8
      legend:
        title:
          text: "Wind Speed"
      title:
        text: Wind Rose Chart<br><sub>Wind Speed Distribution by Direction</sub>
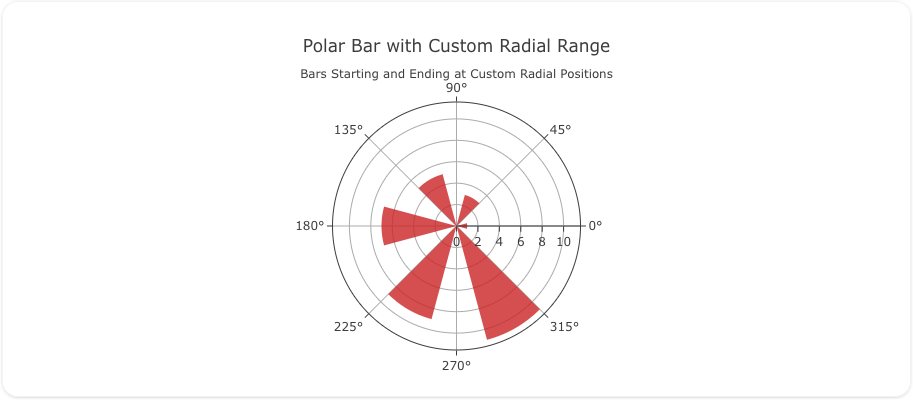
You can customize the radial range to represent data starting and ending at specific radial positions:
sources:
  - name: custom-radial-data-source
    type: duckdb
    database: target/seeds/custom_radial_data.duckdb
    seeds:
      - table_name: model
        args:
          - echo
          - |
            direction,radial_start,radial_end
            0,1,3
            60,2,5
            120,3,6
            180,1,4
            240,2,7
            300,3,5

models:
  - name: custom-radial-data
    source: ${ref(custom-radial-data-source)}
    sql: select * from model
insights:
  - name: Custom Radial Barpolar
    props:
      type: barpolar
      theta: ?{${ref(custom-radial-data).direction}}
      # use radial_end (or radial_length) depending on how you want to render
      r: ?{${ref(custom-radial-data).radial_end}}
      width: 30
      marker:
        color: "#d62728"
      opacity: 0.8
    interactions:
      - sort: ?{ direction }

charts:
  - name: Custom Radial Barpolar Chart
    insights:
      - ${ref(Custom Radial Barpolar)}
    layout:
      polar:
        radialaxis:
          visible: true
      title:
        text: Polar Bar with Custom Radial Range<br><sub>Bars Starting and Ending at Custom Radial Positions</sub>