Candlestick
Overview
The candlestick insight type is commonly used in financial analysis to visualize the price movements of a stock or asset over time. It requires open, high, low, and close (OHLC) data and is useful for tracking the performance of a stock or identifying market trends.
You can control the appearance of candlestick charts through attributes such as increasing, decreasing, line, fillcolor, and more to highlight upward and downward trends in the market.
Common Uses
- Stock Market Analysis: Visualizing the performance of stocks over time.
- Trend Identification: Identifying market trends such as uptrends, downtrends, or reversals.
- Price Fluctuation Visualization: Showing how stock prices move within a specific time period (daily, weekly, etc.).
See the Attributes for the full set of configuration options.
Examples
Common Configurations
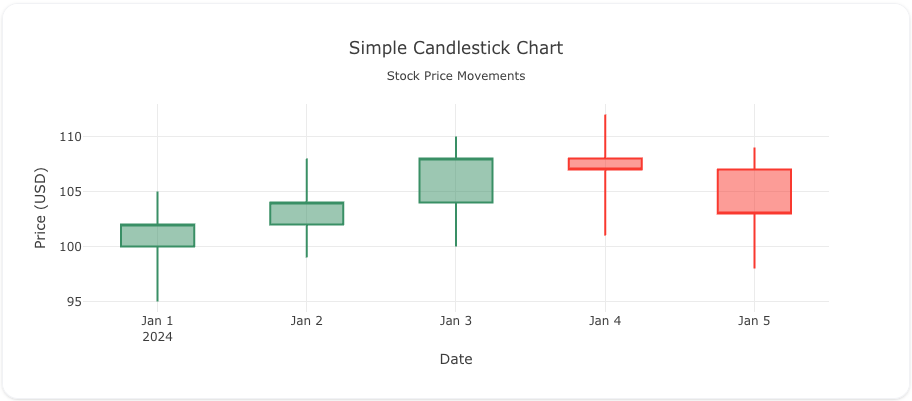
Here's a simple candlestick plot showing stock price movements over a period:
sources:
  - name: stock-data-source
    type: duckdb
    database: target/seeds/stock_data.duckdb
    seeds:
      - table_name: model
        args:
          - echo
          - |
            date,open,high,low,close
            2024-01-01,100,105,95,102
            2024-01-02,102,108,99,104
            2024-01-03,104,110,100,108
            2024-01-04,108,112,101,107
            2024-01-05,107,109,98,103

models:
  - name: stock-data
    source: ${ref(stock-data-source)}
    sql: select * from model
insights:
  - name: Simple Candlestick Plot
    props:
      type: candlestick
      x: ?{${ref(stock-data).date}}
      open: ?{${ref(stock-data).open}}
      high: ?{${ref(stock-data).high}}
      low: ?{${ref(stock-data).low}}
      close: ?{${ref(stock-data).close}}

charts:
  - name: Simple Candlestick Chart
    insights:
      - ${ref(Simple Candlestick Plot)}
    layout:
      title:
        text: Simple Candlestick Chart<br><sub>Stock Price Movements</sub>
      xaxis:
        rangeslider:
          visible: false
        title:
          text: "Date"
      yaxis:
        title:
          text: "Price (USD)"
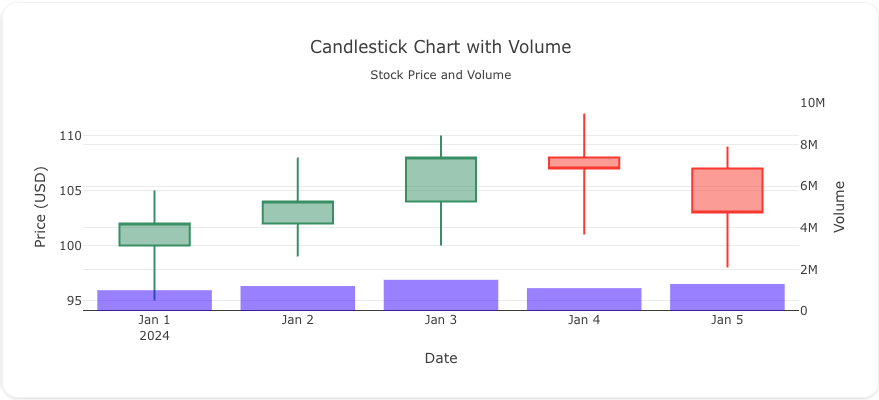
This example includes both candlestick data and volume, providing additional insights into the market activity:
sources:
  - name: stock-data-with-volume-source
    type: duckdb
    database: target/seeds/stock_data_with_volume.duckdb
    seeds:
      - table_name: model
        args:
          - echo
          - |
            date,open,high,low,close,volume
            2024-01-01,100,105,95,102,1000000
            2024-01-02,102,108,99,104,1200000
            2024-01-03,104,110,100,108,1500000
            2024-01-04,108,112,101,107,1100000
            2024-01-05,107,109,98,103,1300000

models:
  - name: stock-data-with-volume
    source: ${ref(stock-data-with-volume-source)}
    sql: select * from model
insights:
  - name: Candlestick Plot with Volume
    props:
      type: candlestick
      x: ?{${ref(stock-data-with-volume).date}}
      open: ?{${ref(stock-data-with-volume).open}}
      high: ?{${ref(stock-data-with-volume).high}}
      low: ?{${ref(stock-data-with-volume).low}}
      close: ?{${ref(stock-data-with-volume).close}}

  - name: Volume Insight
    props:
      type: bar
      x: ?{${ref(stock-data-with-volume).date}}
      y: ?{${ref(stock-data-with-volume).volume}}
      yaxis: "y2"
      marker:
        opacity: 0.5
        color: "blue"

charts:
  - name: Candlestick Chart with Volume
    insights:
      - ${ref(Candlestick Plot with Volume)}
      - ${ref(Volume Insight)}
    layout:
      showlegend: false
      title:
        text: Candlestick Chart with Volume<br><sub>Stock Price and Volume</sub>
      xaxis:
        title:
          text: "Date"
        rangeslider:
          visible: false
      yaxis:
        title:
          text: "Price (USD)"
      yaxis2:
        title:
          text: "Volume"
        overlaying: "y"
        side: "right"
        range: [0, 10000000]
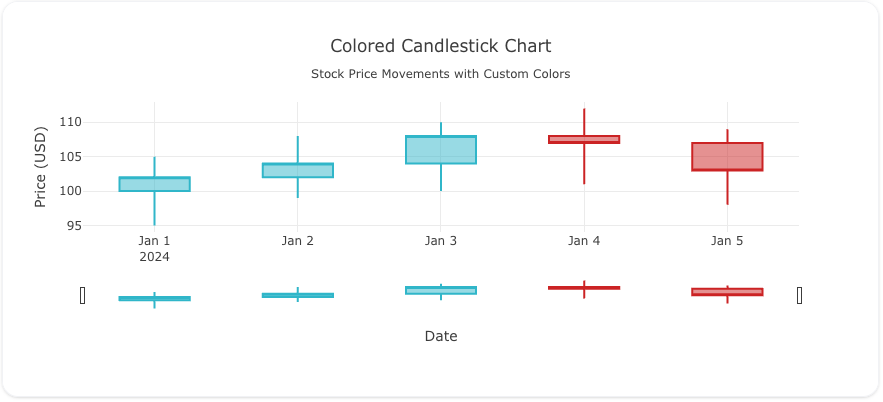
Here's a candlestick chart with customized colors for increasing and decreasing stock prices:
sources:
  - name: stock-data-colored-source
    type: duckdb
    database: target/seeds/stock_data_colored.duckdb
    seeds:
      - table_name: model
        args:
          - echo
          - |
            date,open,high,low,close
            2024-01-01,100,105,95,102
            2024-01-02,102,108,99,104
            2024-01-03,104,110,100,108
            2024-01-04,108,112,101,107
            2024-01-05,107,109,98,103

models:
  - name: stock-data-colored
    source: ${ref(stock-data-colored-source)}
    sql: select * from model
insights:
  - name: Colored Candlestick Plot
    props:
      type: candlestick
      x: ?{${ref(stock-data-colored).date}}
      open: ?{${ref(stock-data-colored).open}}
      high: ?{${ref(stock-data-colored).high}}
      low: ?{${ref(stock-data-colored).low}}
      close: ?{${ref(stock-data-colored).close}}
      increasing:
        line:
          color: "#17becf"
      decreasing:
        line:
          color: "#d62728"

charts:
  - name: Candlestick with Custom Colors
    insights:
      - ${ref(Colored Candlestick Plot)}
    layout:
      title:
        text: Colored Candlestick Chart<br><sub>Stock Price Movements with Custom Colors</sub>
      xaxis:
        title:
          text: "Date"
      yaxis:
        title:
          text: "Price (USD)"