Carpet
Overview
The carpet insight is used to create carpet plots, which can be useful for visualizing data across irregular spaces or non-grid-like arrangements. Carpet plots are commonly employed in complex datasets that span two independent variables, such as pressure and temperature or other bivariate datasets.
Carpet insights provide you with control over the X and Y axes, as well as customization of the A and B axes (the independent variables). You can also use a variety of formatting options, including line, color, and axis ticks to enhance the visualization.
Common Uses
- Distortion Analysis: Visualizing data across irregular spaces, such as in physics or engineering.
- Bivariate Data Visualization: Displaying complex relationships between two independent variables.
- Gridless Data Representation: Visualizing data that doesn't fit neatly into grid-like structures.
Check out the Attributes for the full set of configuration options
Examples
Common Configurations
Here's a simple(ish) carpet plot showing data across two independent variables (A and B):
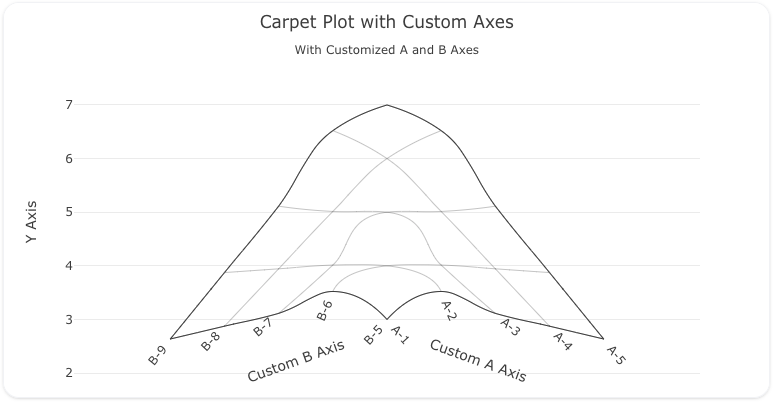
You can copy this code below to create this chart in your project:
sources:
  - name: carpet-data-axes-source
    type: duckdb
    database: target/seeds/carpet_data_axes.duckdb
    seeds:
      - table_name: model
        args:
          - echo
          - |
            a,b,x,y
            1,5,2,3
            2,6,3,4
            3,7,4,5
            4,8,5,6
            5,9,6,7
models:
  - name: carpet-data-axes
    source: ${ref(carpet-data-axes-source)}
    sql: select * from model
insights:
  - name: Carpet Plot with Custom Axes
    props:
      type: carpet
      a: ?{a}
      b: ?{b}
      y: ?{y}
      aaxis:
        title:
          text: "Custom A Axis"
        tickprefix: "A-"
      baxis:
        title:
          text: "Custom B Axis"
        tickprefix: "B-"
charts:
  - name: Simple Carpet Chart
    insights:
      - ${ref(Carpet Plot with Custom Axes)}
    layout:
      title:
        text: Carpet Plot with Custom Axes<br><sub>With Customized A and B Axes</sub>
      xaxis:
        title:
          text: "X Axis"
      yaxis:
        title:
          text: "Y Axis"
      margin:
        b: 0
        r: 70
        l: 70
        t: 50