Choropleth
Overview
The choropleth insight is used to create choropleth maps, which represent data through color intensity across different geographic regions. This insight is commonly used to display data such as population density, election results, or any data that can be associated with geographic regions.
The choropleth insight allows you to control the region coloring based on a variable, and you can customize the map's appearance using color scales, hover labels, and other styling options.
Common Uses
- Geographic Data Visualization: Showing data distributions across countries, states, or other regions.
- Density Mapping: Displaying population or other density metrics across regions.
- Thematic Mapping: Creating maps that represent different data points based on a color gradient (e.g., GDP, COVID-19 cases).
Examples
Common Configurations
Here's a simple choropleth map showing population density across different countries:
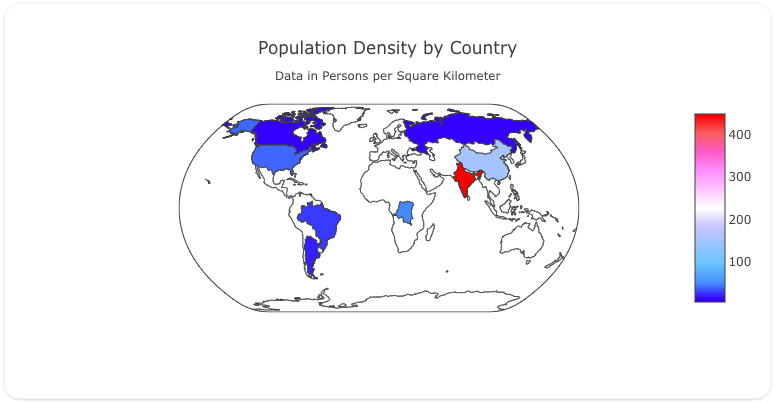
You can copy this code below to create this chart in your project:
sources:
  - name: country-population-data-source
    type: duckdb
    database: target/seeds/country_population_data.duckdb
    seeds:
      - table_name: model
        args:
          - echo
          - |
            country,population_density
            USA,38
            BRA,25
            ARG,17
            UK,286
            CAN,4
            RUS,9
            CHN,153
            IND,450
            COD,48
models:
  - name: country-population-data
    source: ${ref(country-population-data-source)}
    sql: select * from model
insights:
  - name: Simple Choropleth Map
    props:
      type: choropleth
      locations: ?{${ref(country-population-data).country}}
      z: ?{${ref(country-population-data).population_density}}
      colorscale: "Picnic"
charts:
  - name: Simple Choropleth Map
    insights:
      - ${ref(Simple Choropleth Map)}
    layout:
      title:
        text: Population Density by Country<br><sub>Data in Persons per Square Kilometer</sub>
      geo:
        showcoastlines: true
        projection:
          type: "natural earth"