Cone
Overview
The cone insight type is used to create 3D cone plots, which are useful for visualizing vector fields or directional data in three-dimensional space. Each cone represents a vector, with its position, size, and orientation conveying information about the vector's magnitude and direction.
Cone plots are particularly useful in scientific and engineering applications, such as fluid dynamics, electromagnetic field visualization, or wind direction and speed mapping.
Common Uses
- Vector Field Visualization: Displaying 3D vector fields in physics or engineering.
- Wind Data Representation: Showing wind direction and speed in meteorology.
- Fluid Flow Analysis: Visualizing fluid dynamics in simulations or experiments.
Check out the Attributes for the full set of configuration options
Examples
Common Configurations
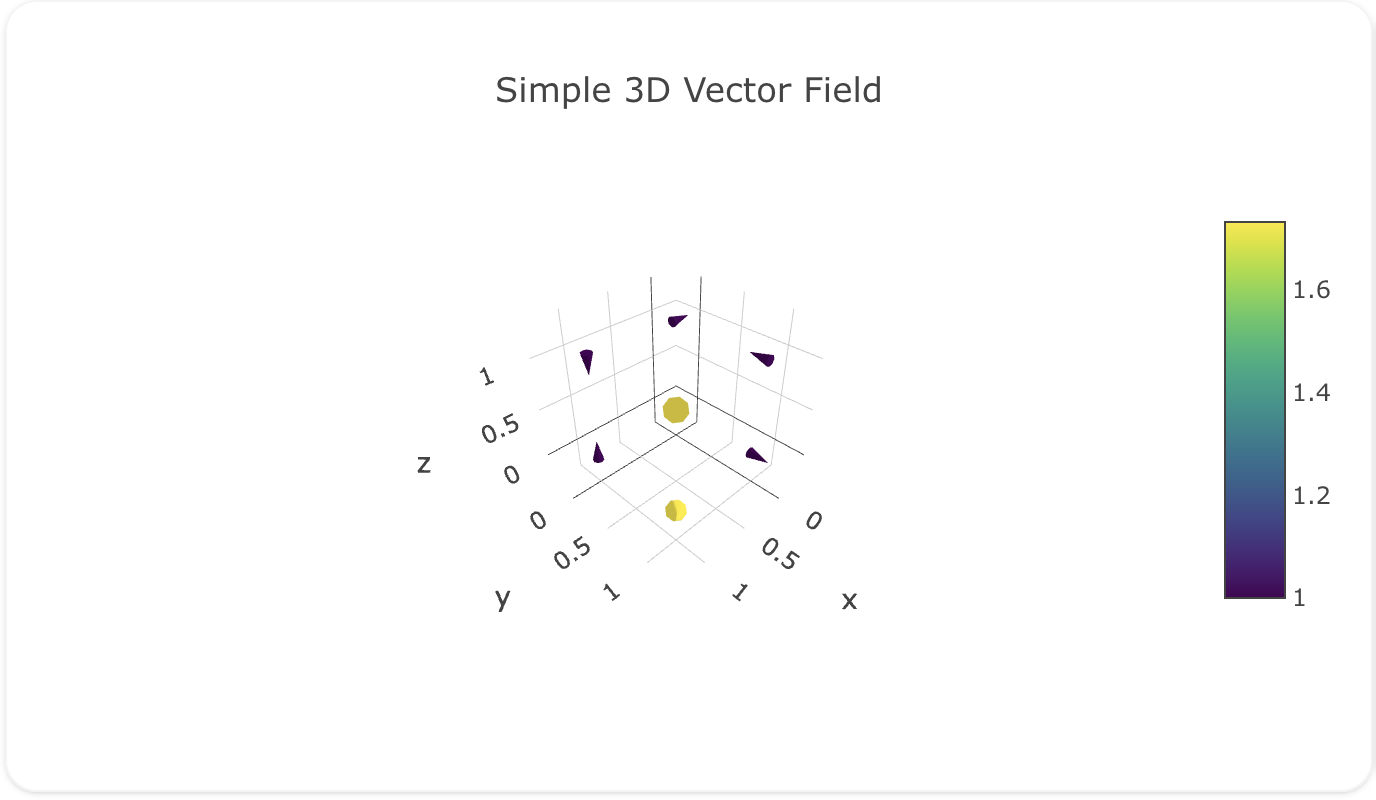
Here's a simple cone plot showing a basic vector field:
sources:
  - name: vector-field-data-source
    type: duckdb
    database: target/seeds/vector_field_data.duckdb
    seeds:
      - table_name: model
        args:
          - echo
          - |
            x,y,z,u,v,w
            0,0,0,1,0,0
            0,1,0,0,1,0
            1,0,0,0,0,1
            1,1,0,1,1,1
            0,0,1,-1,0,0
            0,1,1,0,-1,0
            1,0,1,0,0,-1
            1,1,1,-1,-1,-1
models:
  - name: vector-field-data
    source: ${ref(vector-field-data-source)}
    sql: select * from model
insights:
  - name: Simple Cone Plot
    props:
      type: cone
      x: ?{${ref(vector-field-data).x}}
      y: ?{${ref(vector-field-data).y}}
      z: ?{${ref(vector-field-data).z}}
      u: ?{${ref(vector-field-data).u}}
      v: ?{${ref(vector-field-data).v}}
      w: ?{${ref(vector-field-data).w}}
      colorscale: "Viridis"
      sizemode: "absolute"
      sizeref: 0.5
charts:
  - name: Simple Cone Plot Chart
    insights:
      - ${ref(Simple Cone Plot)}
    layout:
      title:
        text: Simple 3D Vector Field
      scene:
        camera:
          eye:
            x: 1.5
            y: 1.5
            z: 1.5
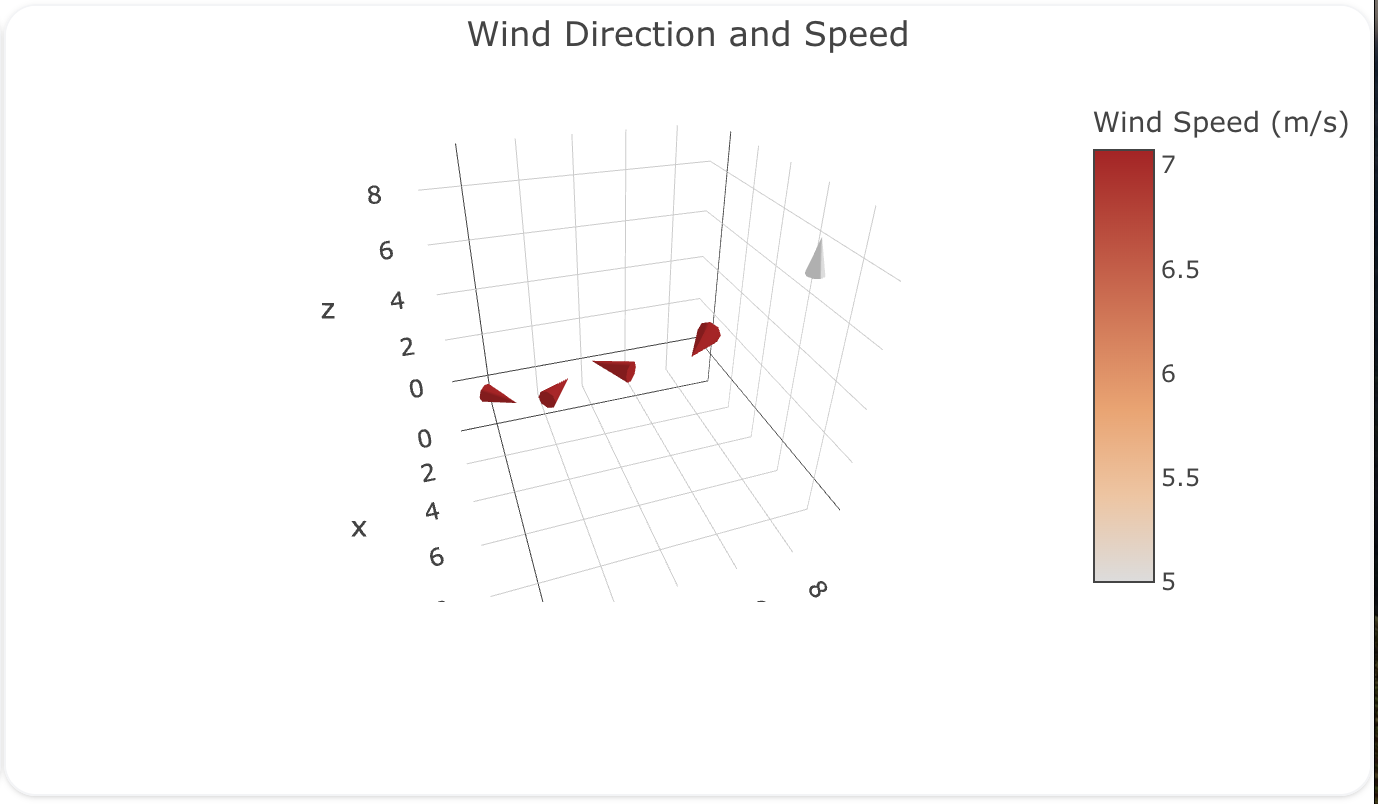
Here's a cone plot showing wind direction and speed:
sources:
  - name: wind-data-source
    type: duckdb
    database: target/seeds/wind_data.duckdb
    seeds:
      - table_name: model
        args:
          - echo
          - |
            x,y,z,u,v,w,speed
            0,0,0,5,5,0,7.07
            1,1,0,-5,5,0,7.07
            2,2,0,-5,-5,0,7.07
            3,3,0,5,-5,0,7.07
            4,4,0,0,0,5,5.00
models:
  - name: wind-data
    source: ${ref(wind-data-source)}
    sql: select * from model
insights:
  - name: Wind Direction Cone Plot
    props:
      type: cone
      x: ?{${ref(wind-data).x}}
      y: ?{${ref(wind-data).y}}
      z: ?{${ref(wind-data).z}}
      u: ?{${ref(wind-data).u}}
      v: ?{${ref(wind-data).v}}
      w: ?{${ref(wind-data).w}}
      colorscale: "Viridis"
      colorbar:
        title: "Wind Speed (m/s)"
      hoverinfo: "text"
      text: ?{${ref(wind-data).speed}}
charts:
  - name: Wind Direction Cone Plot Chart
    insights:
      - ${ref(Wind Direction Cone Plot)}
    layout:
      title:
        text: Wind Direction and Speed
      scene:
        camera:
          eye:
            x: 1.5
            y: -.5
            z: 1.1
      margin:
        l: 90
        r: 0
        t: 40
        b: 90