Contour
Overview
The contour insight type is used to create contour plots, which display three-dimensional data in a two-dimensional format. Contour plots are particularly useful for representing surfaces such as elevation, temperature, pressure, or intensity distributions.
They use a grid of Z values (with optional X and Y coordinates) to generate continuous contour lines or filled regions, allowing you to easily visualize gradients and variations across a surface.
Common Uses
- Topographic Maps: Visualizing elevation across a landscape.
- Heat/Temperature Maps: Showing temperature gradients over an area.
- Electromagnetic Fields: Representing varying field strengths.
- Pressure Maps: Displaying pressure levels in meteorology.
See the Attributes for the full list of configuration options.
Examples
Common Configurations
A basic contour insight using X, Y, and Z values:
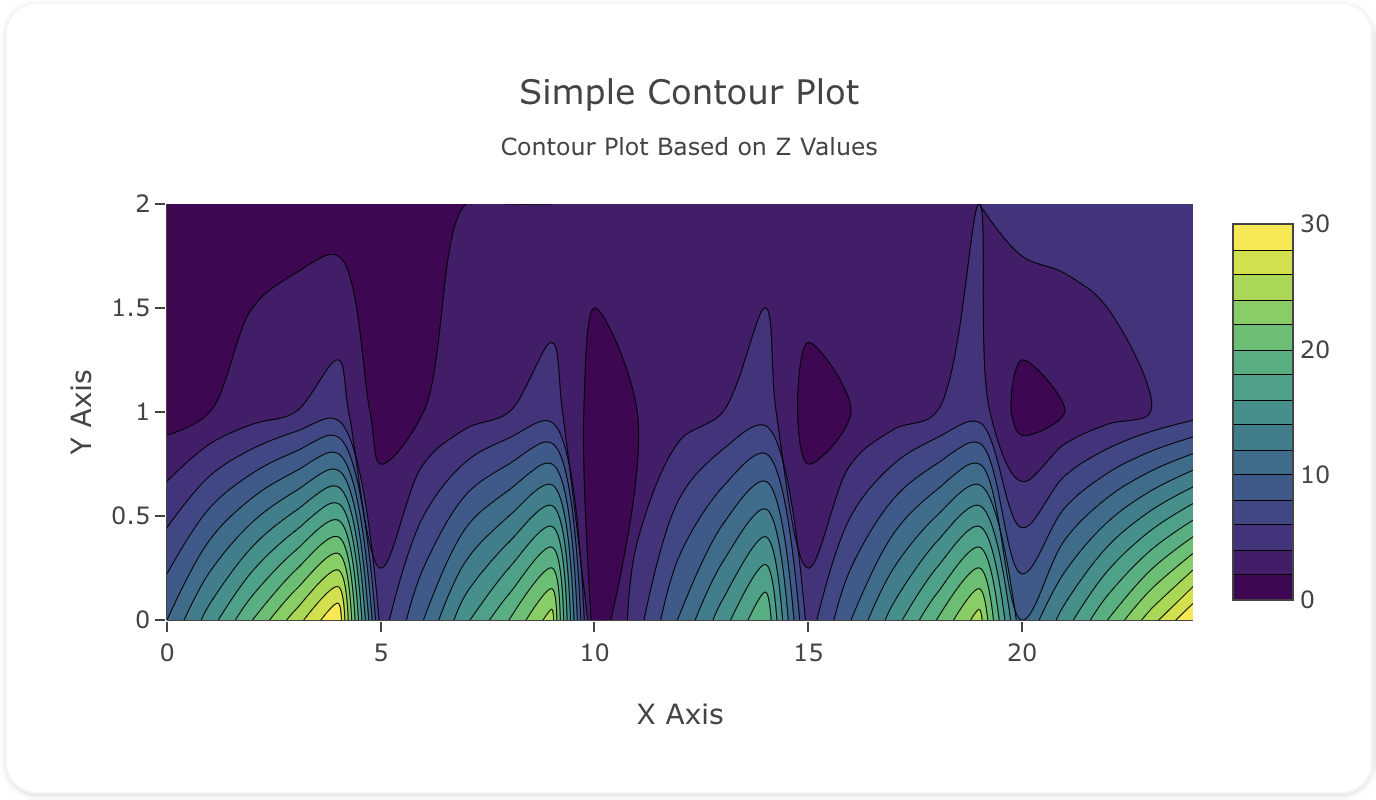
insights:
  - name: Simple Contour Insight
    description: "Basic contour plot using X, Y, Z"
    props:
      type: contour
      x: ?{${ref(contour-data).x}}
      y: ?{${ref(contour-data).y}}
      z: ?{${ref(contour-data).z}}
      colorscale: "Viridis"
      ncontours: 20
    layout:
      title:
        text: Simple Contour Plot<br><sub>Based on Z Values</sub>
      xaxis:
        title: "X Axis"
      yaxis:
        title: "Y Axis"
Adds filled color regions between contour lines for better gradient visualization:
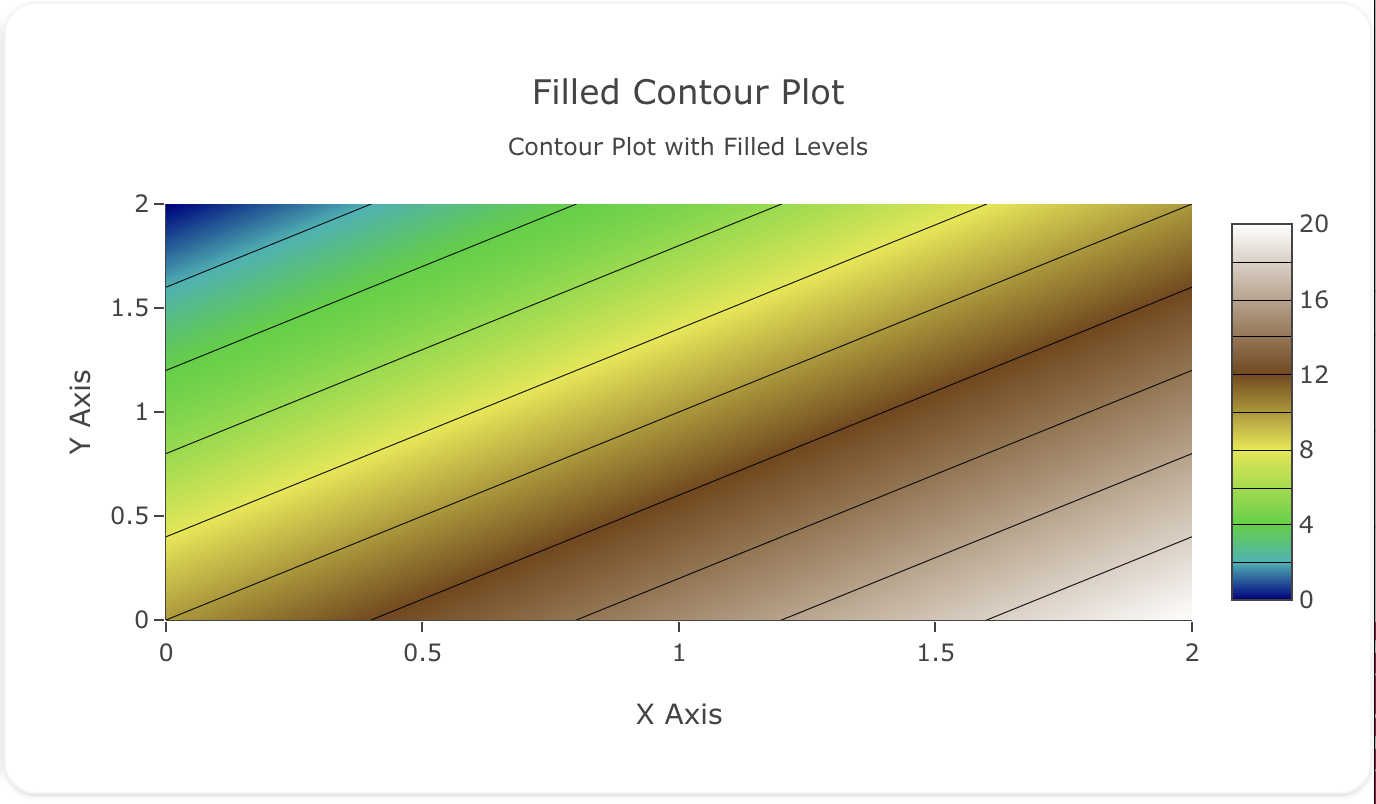
insights:
  - name: Filled Contour Insight
    description: "Contour plot with heatmap coloring"
    props:
      type: contour
      x: ?{${ref(contour-data-filled).x}}
      y: ?{${ref(contour-data-filled).y}}
      z: ?{${ref(contour-data-filled).z}}
      colorscale: "Earth"
      contours:
        coloring: "heatmap"
        showlines: true
      ncontours: 25
    layout:
      title:
        text: Filled Contour Plot<br><sub>Shaded Levels</sub>
      xaxis:
        title: "X Axis"
      yaxis:
        title: "Y Axis"
Demonstrates manual control over contour ranges and intervals:
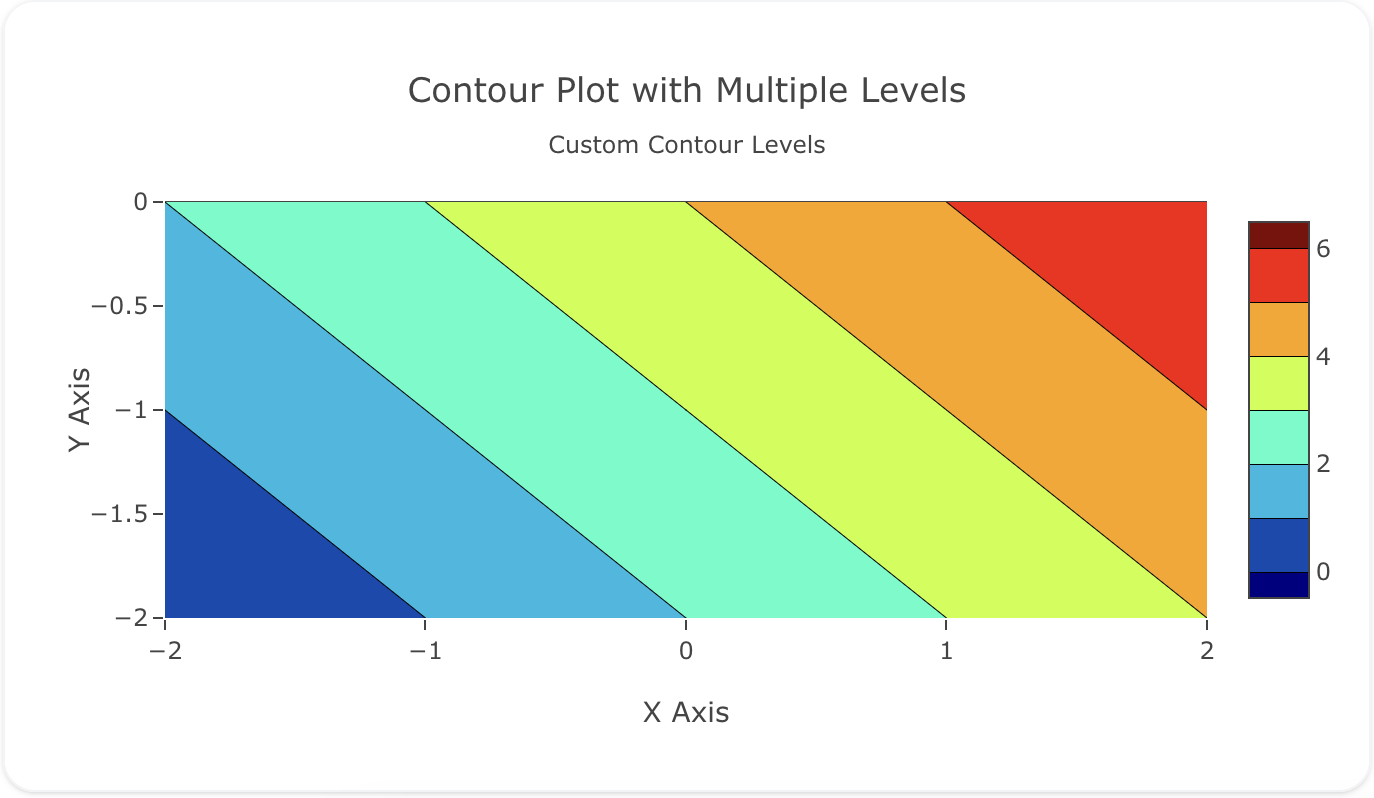
insights:
  - name: Multi-Level Contour Insight
    description: "Contour plot with custom contour levels"
    props:
      type: contour
      x: ?{${ref(contour-data-multi).x}}
      y: ?{${ref(contour-data-multi).y}}
      z: ?{${ref(contour-data-multi).z}}
      colorscale: "Jet"
      contours:
        start: 0
        end: 12
        size: 0.5
      ncontours: 24
    layout:
      title:
        text: Contour Plot with Custom Levels
      xaxis:
        title: "X Axis"
      yaxis:
        title: "Y Axis"