Funnel
Overview
The funnel insight type is used to create funnel charts, which visualize data across stages in a process. Funnel charts are often used in sales or marketing to show how data decreases as it passes through each stage (e.g., from leads to closed deals).
You can control the orientation, marker styles, and colors to better represent your data flow. Funnel charts help in identifying bottlenecks or drop-off points in a process.
Common Uses
- Sales Funnels: Tracking the stages from lead generation to closing a deal.
- Conversion Funnels: Visualizing the steps in a user journey and where drop-offs occur.
- Progression Through Stages: Representing data at different stages of a sequential process.
Check out the Attributes for the full set of configuration options
Examples
Common Configurations
Here's a simple funnel insight showing data as it moves through various stages:
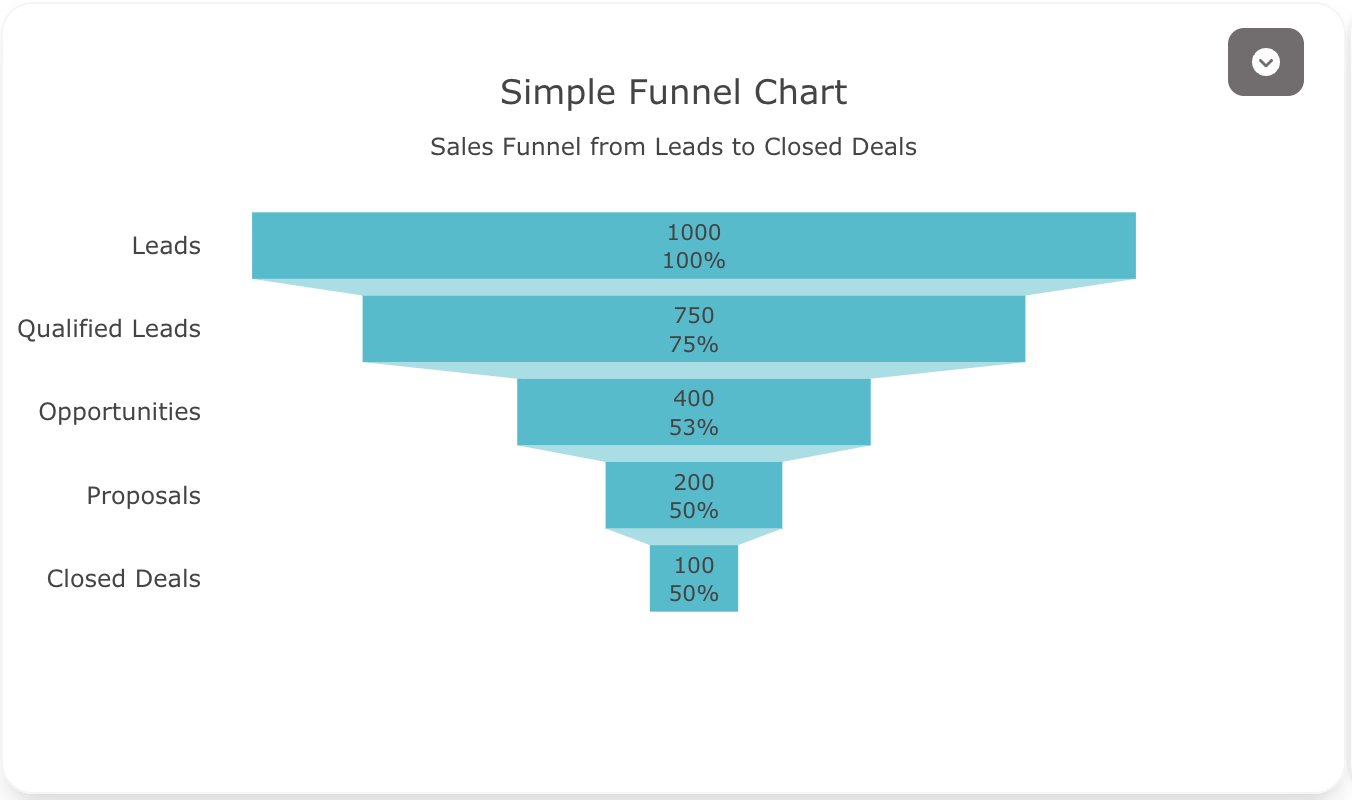
sources:
  - name: funnel-data-source
    type: duckdb
    database: target/seeds/funnel_data.duckdb
    seeds:
      - table_name: model
        args:
          - echo
          - |
            stage,value
            Leads,1000
            Qualified Leads,750
            Opportunities,400
            Proposals,200
            Closed Deals,100
models:
  - name: funnel-data
    source: ${ref(funnel-data-source)}
    sql: select * from model
insights:
  - name: Simple Funnel Insight
    props:
      type: funnel
      y: ?{${ref(funnel-data).stage}}
      x: ?{${ref(funnel-data).value}}
      textinfo: "value+percent previous"
      marker:
        color: "#17becf"
    interactions:
      - sort: ?{${ref(funnel-data).value} desc}

charts:
  - name: Simple Funnel Chart
    insights:
      - ${ref(Simple Funnel Insight)}
    layout:
      title:
        text: Simple Funnel Chart<br><sub>Sales Funnel from Leads to Closed Deals</sub>
      xaxis:
        title:
          text: "Stage"
      margin:
        l: 100
This example demonstrates a horizontal funnel chart, with stages represented along the x-axis:
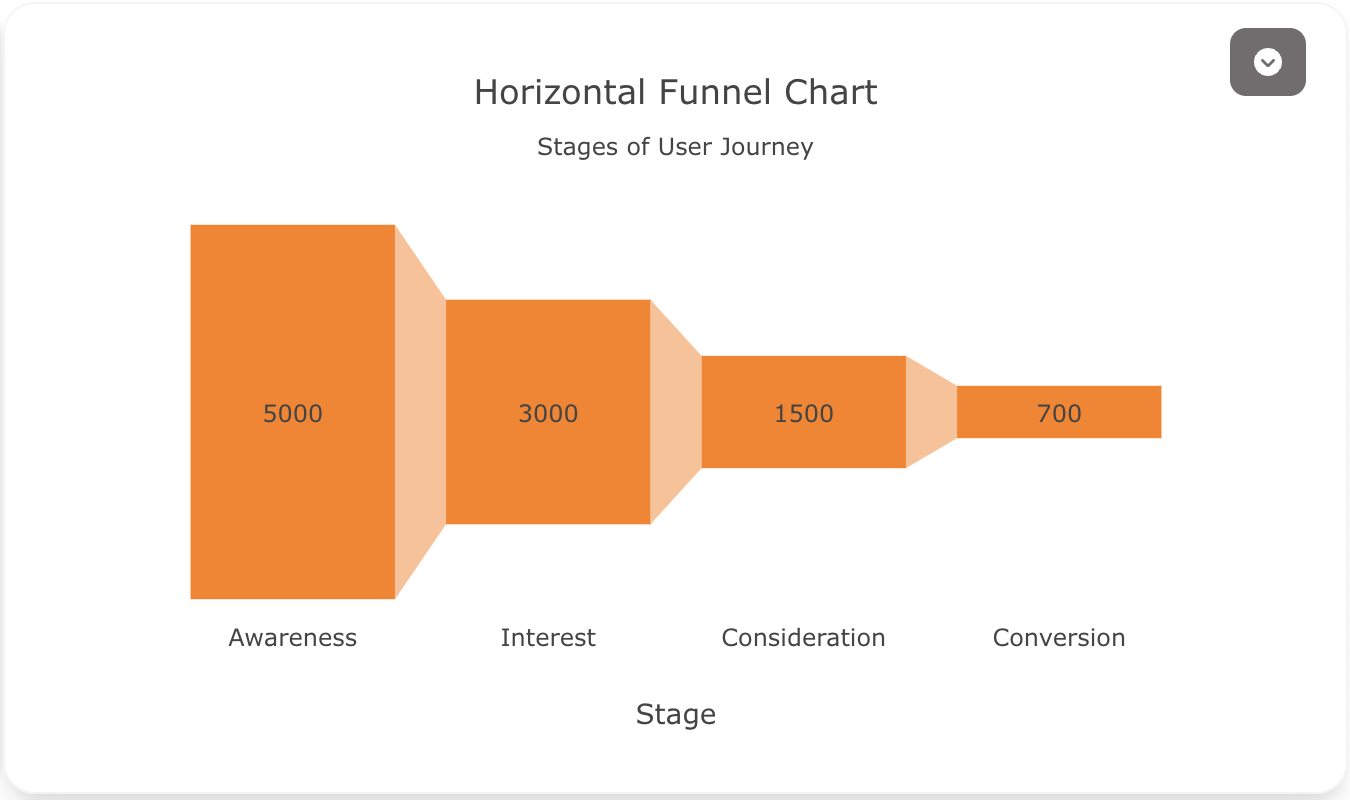
sources:
  - name: funnel-data-horizontal-source
    type: duckdb
    database: target/seeds/funnel_data_horizontal.duckdb
    seeds:
      - table_name: model
        args:
          - echo
          - |
            stage,value
            Awareness,5000
            Interest,3000
            Consideration,1500
            Conversion,700
models:
  - name: funnel-data-horizontal
    source: ${ref(funnel-data-horizontal-source)}
    sql: select * from model
insights:
  - name: Horizontal Funnel Insight
    props:
      type: funnel
      orientation: v
      x: ?{${ref(funnel-data-horizontal).stage}}
      y: ?{${ref(funnel-data-horizontal).value}}
      marker:
        color: "#ff7f0e"
    interactions:
      - sort: ?{${ref(funnel-data-horizontal).value} desc}

charts:
  - name: Horizontal Funnel Chart
    insights:
      - ${ref(Horizontal Funnel Insight)}
    layout:
      title:
        text: Horizontal Funnel Chart<br><sub>Stages of User Journey</sub>
      xaxis:
        title:
          text: "Stage"
Here's a funnel chart where each stage has a different color to highlight distinct phases in the process:
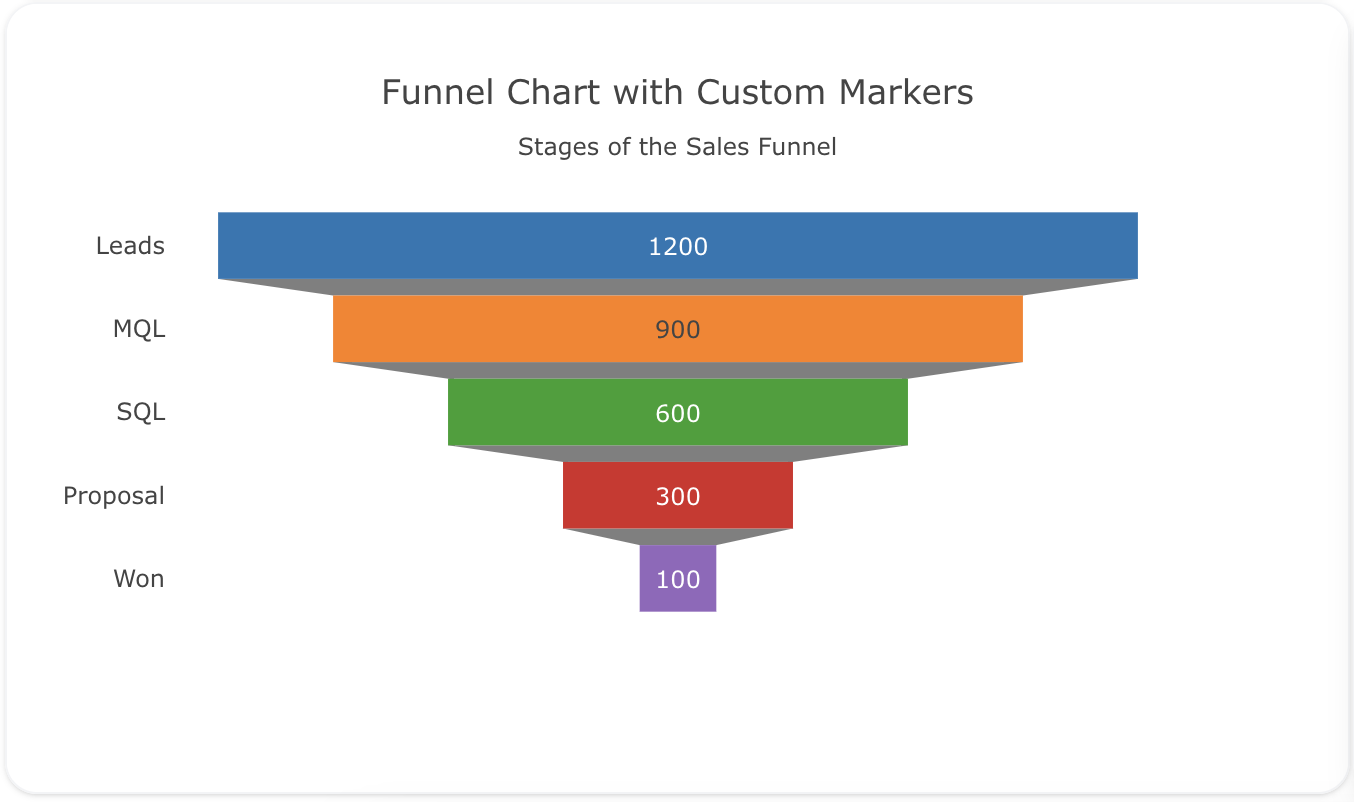
sources:
  - name: funnel-data-custom-source
    type: duckdb
    database: target/seeds/funnel_data_custom.duckdb
    seeds:
      - table_name: model
        args:
          - echo
          - |
            stage,value,color
            Leads,1200,"#1f77b4"
            MQL,900,"#ff7f0e"
            SQL,600,"#2ca02c"
            Proposal,300,"#d62728"
            Won,100,"#9467bd"
models:
  - name: funnel-data-custom
    source: ${ref(funnel-data-custom-source)}
    sql: select * from model
insights:
  - name: Custom Markers Funnel Insight
    props:
      type: funnel
      y: ?{${ref(funnel-data-custom).stage}}
      x: ?{${ref(funnel-data-custom).value}}
      marker:
        color: ?{${ref(funnel-data-custom).color}}
      textinfo: "value+percent"
      orientation: h
    interactions:
      - sort: ?{${ref(funnel-data-custom).value} desc}

charts:
  - name: Funnel Chart with Custom Markers
    insights:
      - ${ref(Custom Markers Funnel Insight)}
    layout:
      title:
        text: Funnel Chart with Custom Markers<br><sub>Stages of the Sales Funnel</sub>
      xaxis:
        title:
          text: "Stage"
This example demonstrates a funnel chart using cohorts to compare the customer journey across different products:
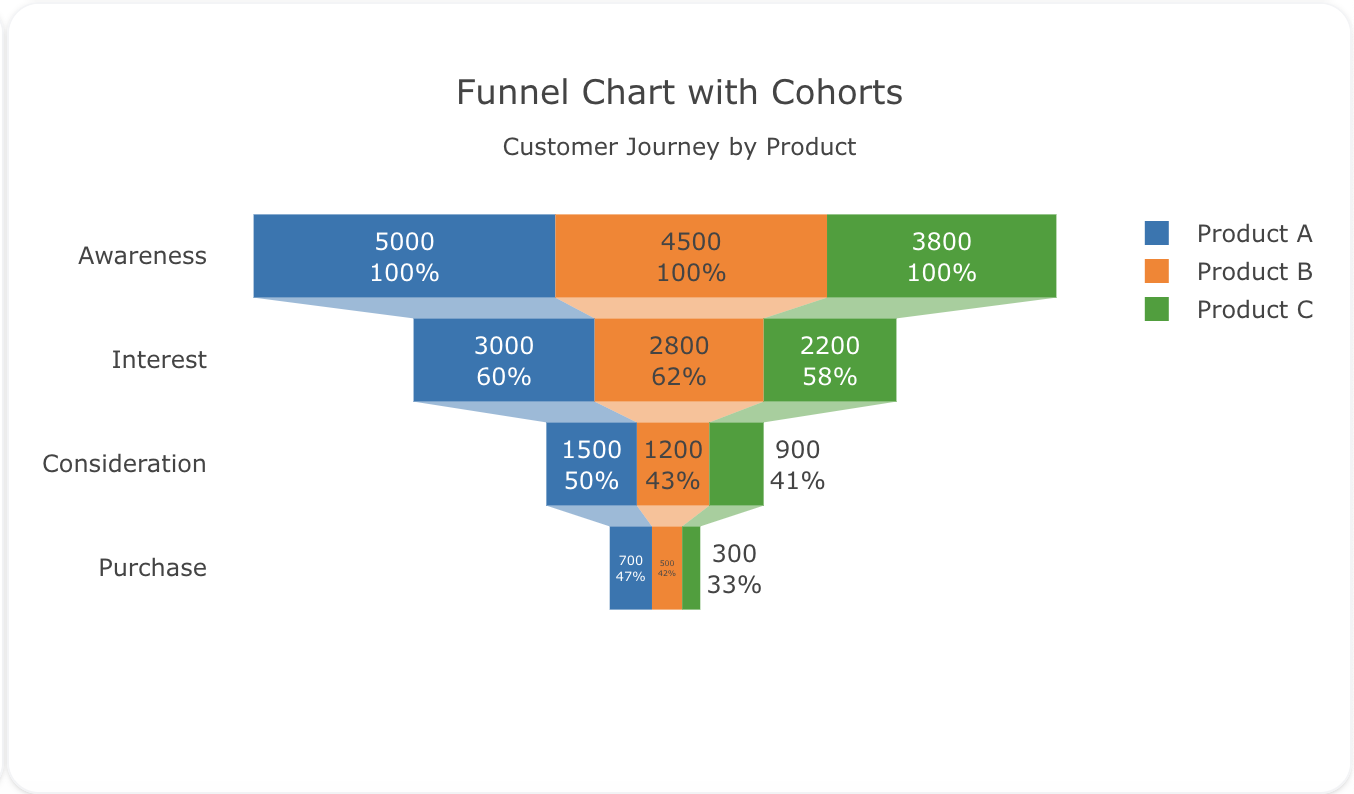
sources:
  - name: funnel-data-cohorts-source
    type: duckdb
    database: target/seeds/funnel_data_cohorts.duckdb
    seeds:
      - table_name: model
        args:
          - echo
          - |
            stage,value,product
            Awareness,5000,Product A
            Interest,3000,Product A
            Consideration,1500,Product A
            Purchase,700,Product A
            Awareness,4500,Product B
            Interest,2800,Product B
            Consideration,1200,Product B
            Purchase,500,Product B
            Awareness,3800,Product C
            Interest,2200,Product C
            Consideration,900,Product C
            Purchase,300,Product C
models:
  - name: funnel-data-cohorts
    source: ${ref(funnel-data-cohorts-source)}
    sql: select * from model
insights:
  - name: Cohort Funnel Insight
    props:
      type: funnel
      y: ?{${ref(funnel-data-cohorts).stage}}
      x: ?{${ref(funnel-data-cohorts).value}}
      textinfo: "value+percent previous"
      marker:
        colorscale: "Viridis"
    interactions:
      - sort: ?{${ref(funnel-data-cohorts).product}}
      - sort: ?{${ref(funnel-data-cohorts).value} desc}
      - split: ?{${ref(funnel-data-cohorts).product}}

charts:
  - name: Funnel Chart with Cohorts
    insights:
      - ${ref(Cohort Funnel Insight)}
    layout:
      title:
        text: Funnel Chart with Cohorts<br><sub>Customer Journey by Product</sub>
      margin:
        l: 100
This example uses the cohort_on attribute to create separate funnel charts for each product, allowing for easy comparison of the customer journey across different products.