Funnelarea
Overview
The funnelarea insight type is used to create funnel area charts, which are similar to funnel charts but are represented as a circular area instead of a linear progression. Funnel area charts are useful for comparing stages in a process with proportional sizes. Each stage is represented as a sector of a circle, and its size represents the magnitude of the data.
You can control the colors, labels, and orientation of the funnel area sections to visualize proportional data across different stages.
Common Uses
- Proportional Stages: Showing the proportion of data at each stage in a circular format.
- Conversion Rates: Visualizing the drop-off rates in different stages of a process.
- Sales and Marketing Funnels: Representing funnels like leads-to-sales in a circular format.
Check out the Attributes for the full set of configuration options
Examples
Common Configurations
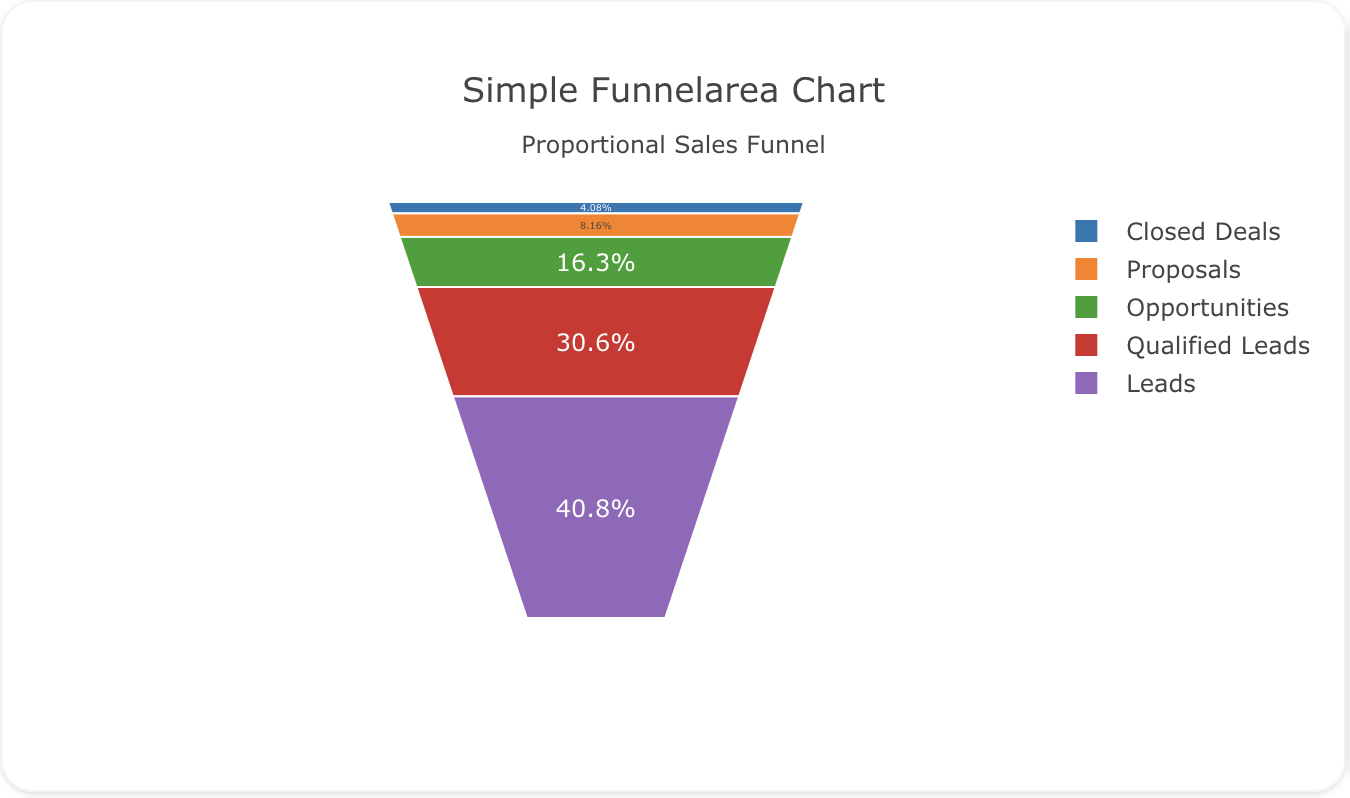
Here's a simple funnelarea insight showing data in a circular funnel format:
sources:
  - name: funnelarea-data-source
    type: duckdb
    database: target/seeds/funnelarea_data.duckdb
    seeds:
      - table_name: model
        args:
          - echo
          - |
            stage,value
            Leads,1000
            Qualified Leads,750
            Opportunities,400
            Proposals,200
            Closed Deals,100
models:
  - name: funnelarea-data
    source: ${ref(funnelarea-data-source)}
    sql: select * from model
insights:
  - name: Simple Funnelarea Insight
    props:
      type: funnelarea
      labels: ?{${ref(funnelarea-data).stage}}
      values: ?{${ref(funnelarea-data).value}}
charts:
  - name: Simple Funnelarea Chart
    insights:
      - ${ref(Simple Funnelarea Insight)}
    layout:
      title:
        text: Simple Funnelarea Chart<br><sub>Proportional Sales Funnel</sub>
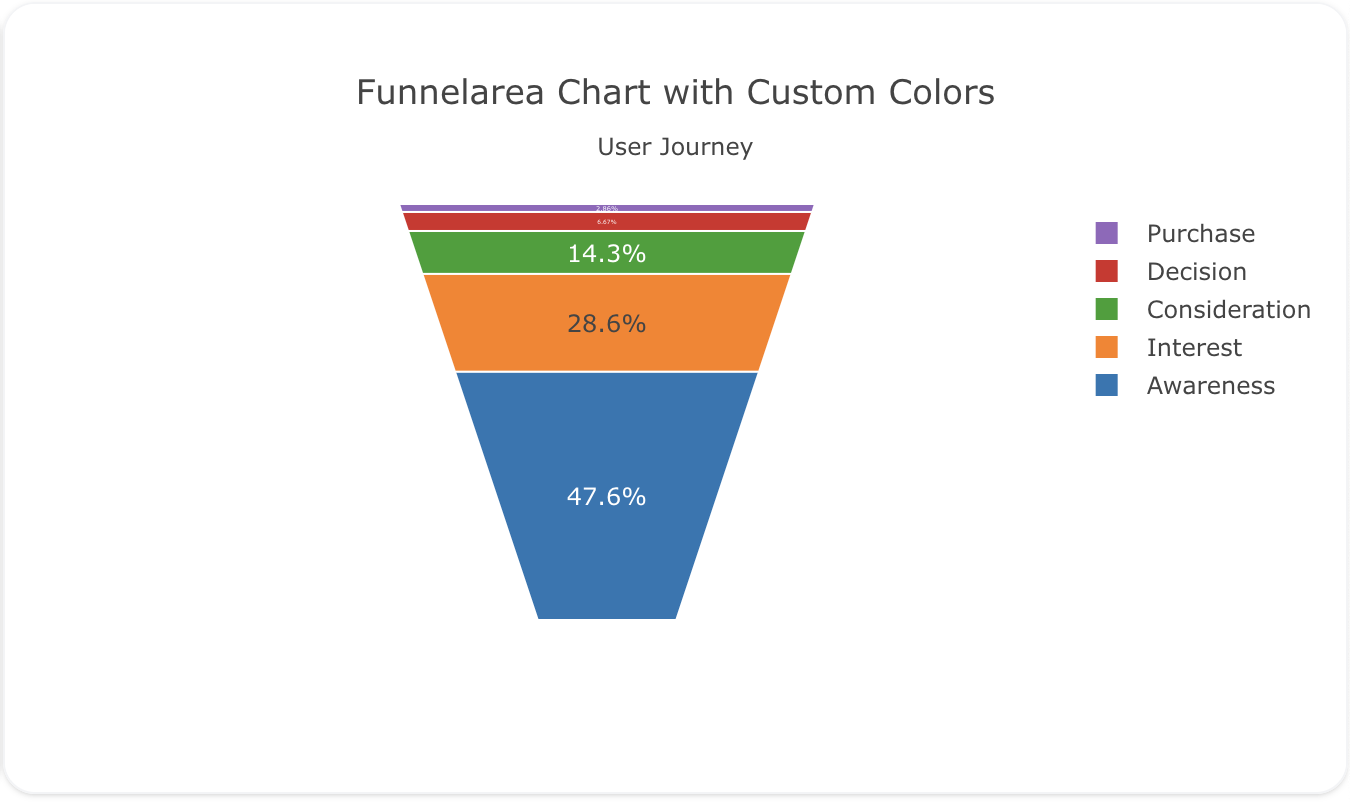
This example shows a funnelarea insight where each stage has a custom color for better differentiation:
sources:
  - name: funnelarea-data-custom-source
    type: duckdb
    database: target/seeds/funnelarea_data_custom.duckdb
    seeds:
      - table_name: model
        args:
          - echo
          - |
            stage,value,color
            Awareness,5000,"#1f77b4"
            Interest,3000,"#ff7f0e"
            Consideration,1500,"#2ca02c"
            Decision,700,"#d62728"
            Purchase,300,"#9467bd"
models:
  - name: funnelarea-data-custom
    source: ${ref(funnelarea-data-custom-source)}
    sql: select * from model
insights:
  - name: Custom Colors Funnelarea Insight
    props:
      type: funnelarea
      labels: ?{${ref(funnelarea-data-custom).stage}}
      values: ?{${ref(funnelarea-data-custom).value}}
      marker:
        colors: ?{${ref(funnelarea-data-custom).color}}
charts:
  - name: Funnelarea Chart with Custom Colors
    insights:
      - ${ref(Custom Colors Funnelarea Insight)}
    layout:
      title:
        text: Funnelarea Chart with Custom Colors<br><sub>User Journey</sub>
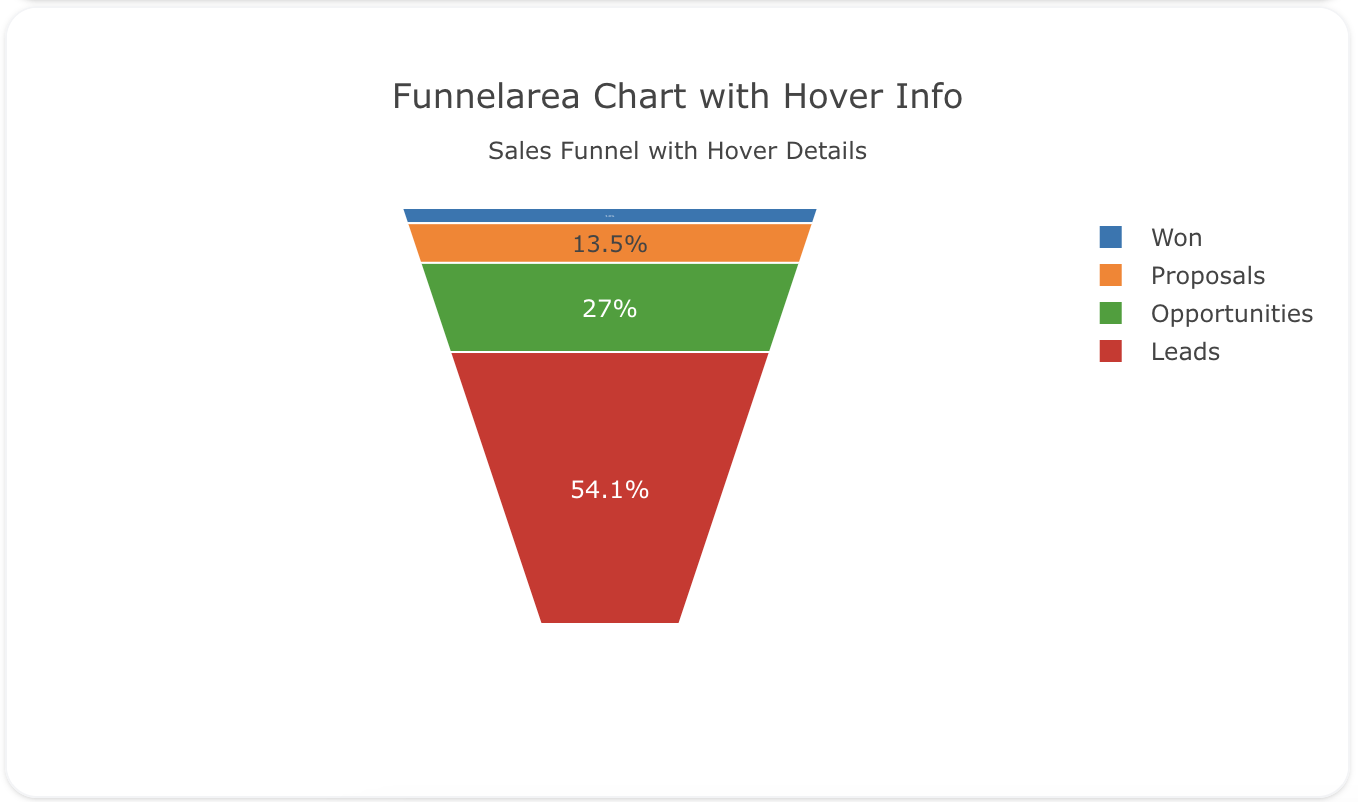
This example demonstrates a funnelarea insight with hover information to show the value and percentage for each stage:
sources:
  - name: funnelarea-data-hover-source
    type: duckdb
    database: target/seeds/funnelarea_data_hover.duckdb
    seeds:
      - table_name: model
        args:
          - echo
          - |
            stage,value
            Leads,1000
            Opportunities,500
            Proposals,250
            Won,100
models:
  - name: funnelarea-data-hover
    source: ${ref(funnelarea-data-hover-source)}
    sql: select * from model
insights:
  - name: Funnelarea Insight with Hover Info
    props:
      type: funnelarea
      labels: ?{${ref(funnelarea-data-hover).stage}}
      values: ?{${ref(funnelarea-data-hover).value}}
      hoverinfo: "label+value+percent"
charts:
  - name: Funnelarea Chart with Hover Info
    insights:
      - ${ref(Funnelarea Insight with Hover Info)}
    layout:
      title:
        text: Funnelarea Chart with Hover Info<br><sub>Sales Funnel with Hover Details</sub>