Heatmap
Overview
The heatmap insight type is used to create heatmaps, which represent data using a grid where values are mapped to colors. Heatmaps are commonly used to visualize matrix-like data, such as correlations, intensity, or frequency distributions.
You can customize the colorscale, gridlines, and other properties to fit your data and visualization needs.
Common Uses
- Correlation Matrices: Visualizing relationships between variables.
- Frequency Distributions: Showing how frequently data points occur across categories.
- Geospatial Heatmaps: Visualizing the density or intensity of occurrences in a 2D space.
Check out the Attributes for the full set of configuration options
Examples
Common Configurations
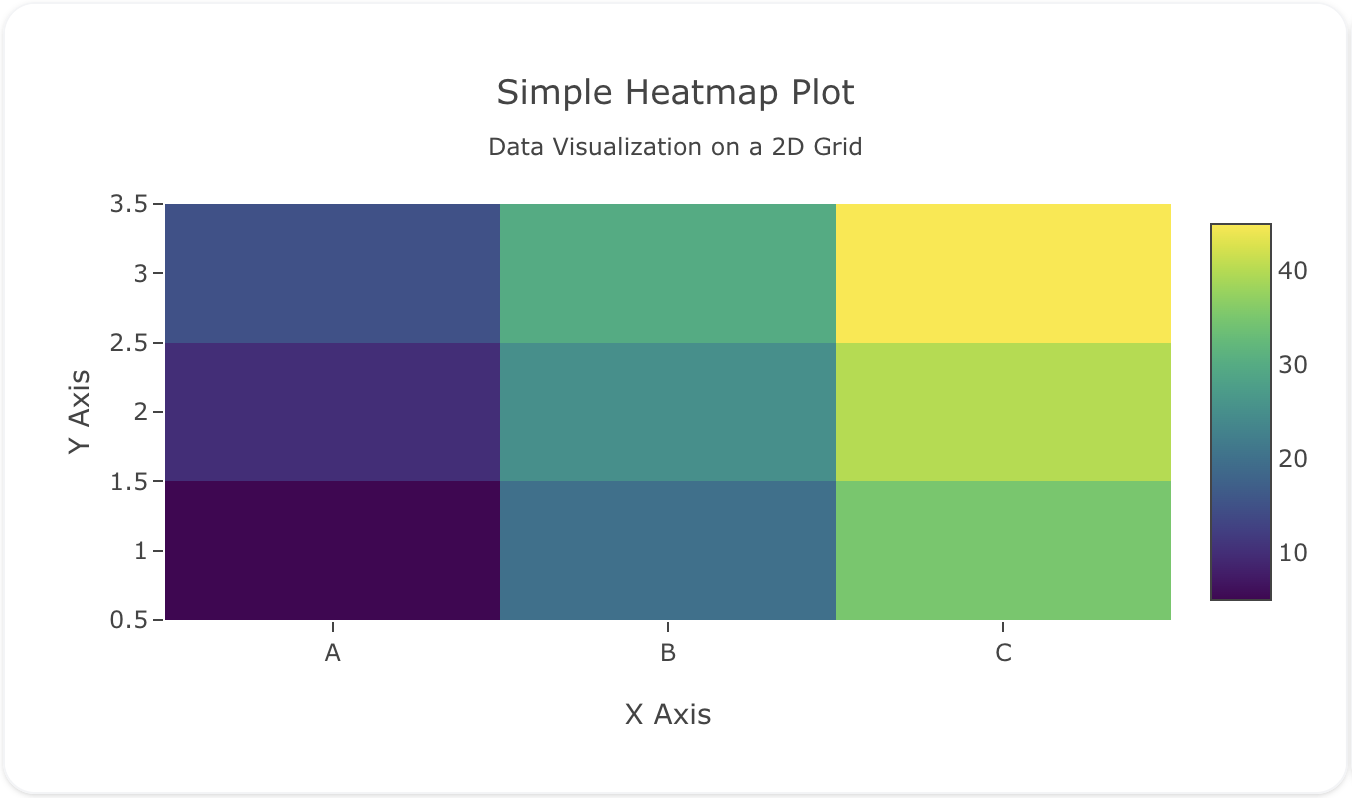
Here's a simple heatmap insight showing data values on a 2D grid:
sources:
  - name: heatmap-data-source
    type: duckdb
    database: target/seeds/heatmap_data.duckdb
    seeds:
      - table_name: model
        args:
          - echo
          - |
            x,y,z
            A,1,5
            A,2,10
            A,3,15
            B,1,20
            B,2,25
            B,3,30
            C,1,35
            C,2,40
            C,3,45
models:
  - name: heatmap-data
    source: ${ref(heatmap-data-source)}
    sql: select * from model
insights:
  - name: Simple Heatmap Insight
    props:
      type: heatmap
      x: ?{${ref(heatmap-data).x}}
      y: ?{${ref(heatmap-data).y}}
      z: ?{${ref(heatmap-data).z}}
      colorscale: "Viridis"
charts:
  - name: Simple Heatmap Chart
    insights:
      - ${ref(Simple Heatmap Insight)}
    layout:
      title:
        text: Simple Heatmap Plot<br><sub>Data Visualization on a 2D Grid</sub>
      xaxis:
        title:
          text: "X Axis"
      yaxis:
        title:
          text: "Y Axis"
sources:
  - name: heatmap-data-custom-source
    type: duckdb
    database: target/seeds/heatmap_data_custom.duckdb
    seeds:
      - table_name: model
        args:
          - echo
          - |
            x,y,z
            Low,A,0.1
            Low,B,0.2
            Low,C,0.3
            Medium,A,0.4
            Medium,B,0.5
            Medium,C,0.6
            High,A,0.7
            High,B,0.8
            High,C,0.9
models:
  - name: heatmap-data-custom
    source: ${ref(heatmap-data-custom-source)}
    sql: select * from model
insights:
  - name: Heatmap with Custom Colorscale
    props:
      type: heatmap
      x: ?{${ref(heatmap-data-custom).x}}
      y: ?{${ref(heatmap-data-custom).y}}
      z: ?{${ref(heatmap-data-custom).z}}
      zmin: 0
      zmax: 1
charts:
  - name: Heatmap Chart with Categorical Axis
    insights:
      - ${ref(Heatmap with Custom Colorscale)}
    layout:
      title:
        text: Heatmap Chart with Categorical Axis<br><sub>Categorical Data</sub>
      xaxis:
        title:
          text: "Priority Level"
        type: "category"
      yaxis:
        title:
          text: "Category"
        type: "category"
sources:
  - name: heatmap-data-annotations-source
    type: duckdb
    database: target/seeds/heatmap_data_annotations.duckdb
    seeds:
      - table_name: model
        args:
          - echo
          - |
            x,y,z
            Q1,2019,100
            Q2,2019,150
            Q3,2019,200
            Q4,2019,250
            Q1,2020,300
            Q2,2020,350
            Q3,2020,400
            Q4,2020,450
models:
  - name: heatmap-data-annotations
    source: ${ref(heatmap-data-annotations-source)}
    sql: select * from model
insights:
  - name: Heatmap with Text Annotations
    props:
      type: heatmap
      x: ?{${ref(heatmap-data-annotations).x}}
      y: ?{${ref(heatmap-data-annotations).y}}
      z: ?{${ref(heatmap-data-annotations).z}}
      text: ?{${ref(heatmap-data-annotations).z}}
      texttemplate: "%{text}"
      textfont:
        size: 12
      colorscale: "Blues"
charts:
  - name: Heatmap Chart with Text Annotations
    insights:
      - ${ref(Heatmap with Text Annotations)}
    layout:
      title:
        text: Heatmap with Text Annotations<br><sub>Data Values Displayed on Each Cell</sub>
      xaxis:
        title:
          text: "Quarter"
      yaxis:
        title:
          text: "Year"