Histogram
Overview
The histogram insight type is used to create histograms, which represent the distribution of numerical data by dividing the data into bins and counting the number of occurrences in each bin. Histograms are great for understanding data distribution, variability, and patterns.
You can customize bin size, orientation, and colors to fit your data. Histograms are especially useful in statistical analysis, data science, and exploratory data analysis.
Common Uses
- Data Distribution: Visualizing how data points are distributed across different ranges.
- Frequency Analysis: Showing the frequency of values within specific intervals.
- Statistical Summaries: Understanding the spread, central tendency, and outliers in data.
Check out the Attributes for the full set of configuration options
Examples
Common Configurations
Here's a simple histogram insight showing the distribution of data across different bins:
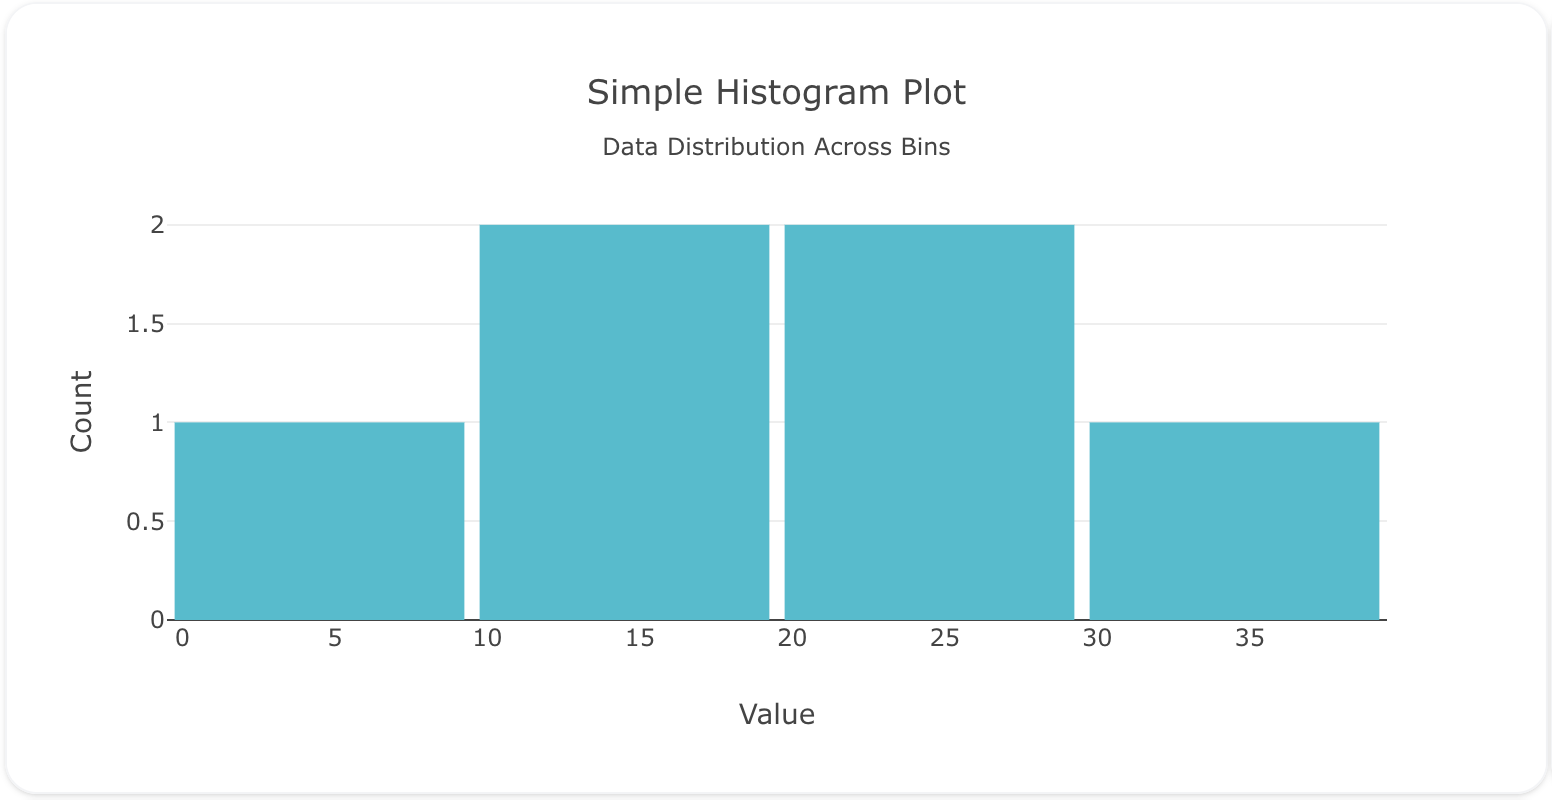
sources:
  - name: histogram-data-source
    type: duckdb
    database: target/seeds/histogram_data.duckdb
    seeds:
      - table_name: model
        args:
          - echo
          - |
            value
            10
            20
            15
            10
            5
            25
            30
            15
            20
            10
models:
  - name: histogram-data
    source: ${ref(histogram-data-source)}
    sql: select * from model
insights:
  - name: Simple Histogram Insight
    props:
      type: histogram
      x: ?{${ref(histogram-data).value}}
      nbinsx: 5
      marker:
        color: "#17becf"
charts:
  - name: Simple Histogram Chart
    insights:
      - ${ref(Simple Histogram Insight)}
    layout:
      title:
        text: Simple Histogram Plot<br><sub>Data Distribution Across Bins</sub>
      xaxis:
        title:
          text: "Value"
      yaxis:
        title:
          text: "Count"
      bargap: 0.05
This example shows a horizontal histogram insight, where the bins are displayed along the y-axis:
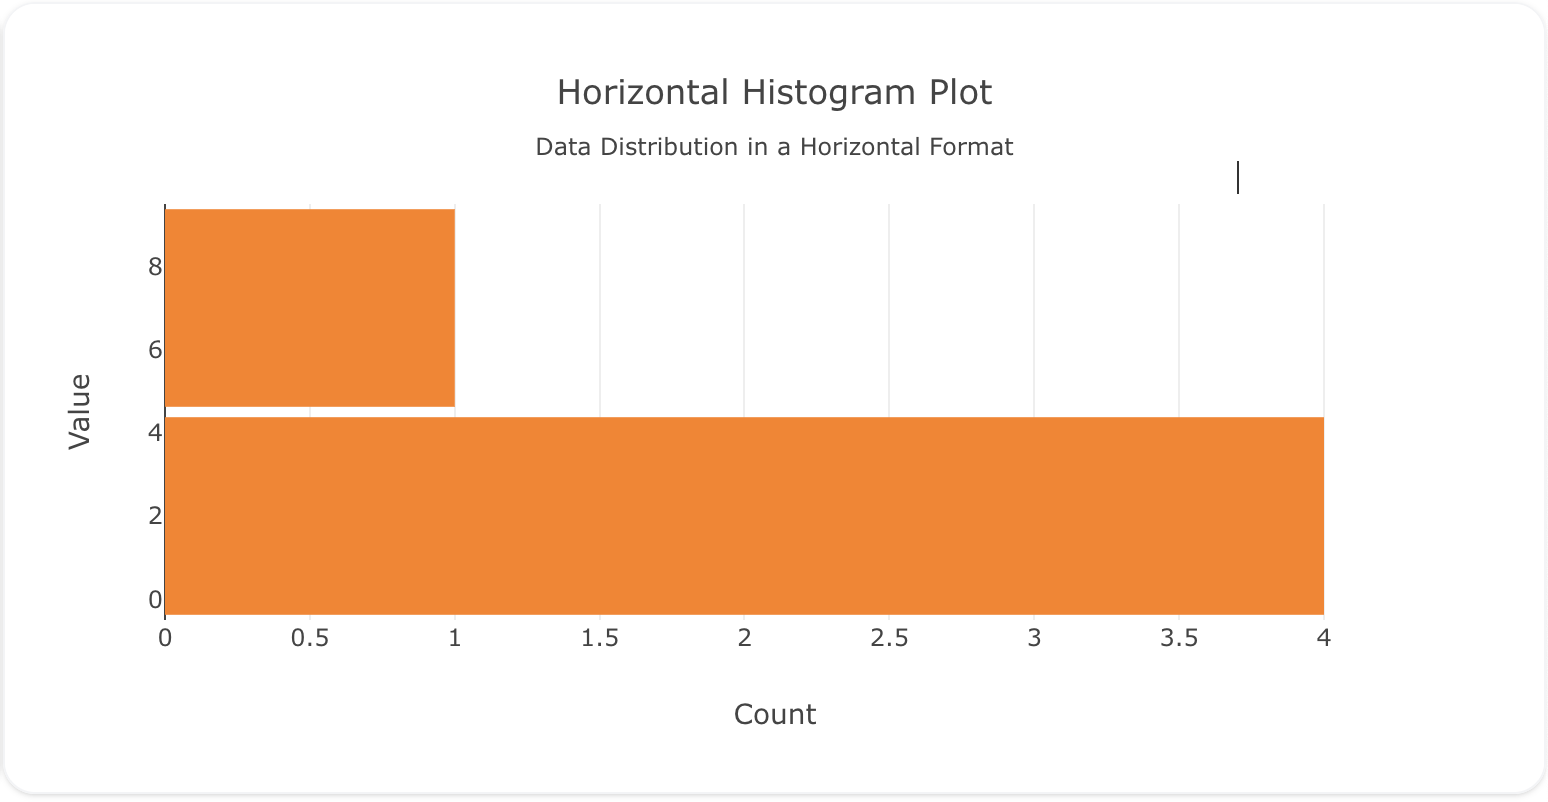
sources:
  - name: histogram-data-horizontal-source
    type: duckdb
    database: target/seeds/histogram_data_horizontal.duckdb
    seeds:
      - table_name: model
        args:
          - echo
          - |
            value
            1
            3
            2
            5
            4
            3
            3
            3
            3
            4
            1
            3
            4
            3
            3
            4
            1
            2
            3
            5
            2
            3
            4
models:
  - name: histogram-data-horizontal
    source: ${ref(histogram-data-horizontal-source)}
    sql: select * from model
insights:
  - name: Horizontal Histogram Insight
    props:
      type: histogram
      y: ?{${ref(histogram-data-horizontal).value}}
      nbinsy: 2
      marker:
        color: "#ff7f0e"
      orientation: h
charts:
  - name: Horizontal Histogram Chart
    insights:
      - ${ref(Horizontal Histogram Insight)}
    layout:
      title:
        text: Horizontal Histogram Plot<br><sub>Data Distribution in a Horizontal Format</sub>
      yaxis:
        title:
          text: "Value"
      xaxis:
        title:
          text: "Count"
      bargap: 0.05
Here's a stacked histogram insight showing the distribution of two different datasets stacked on top of each other:
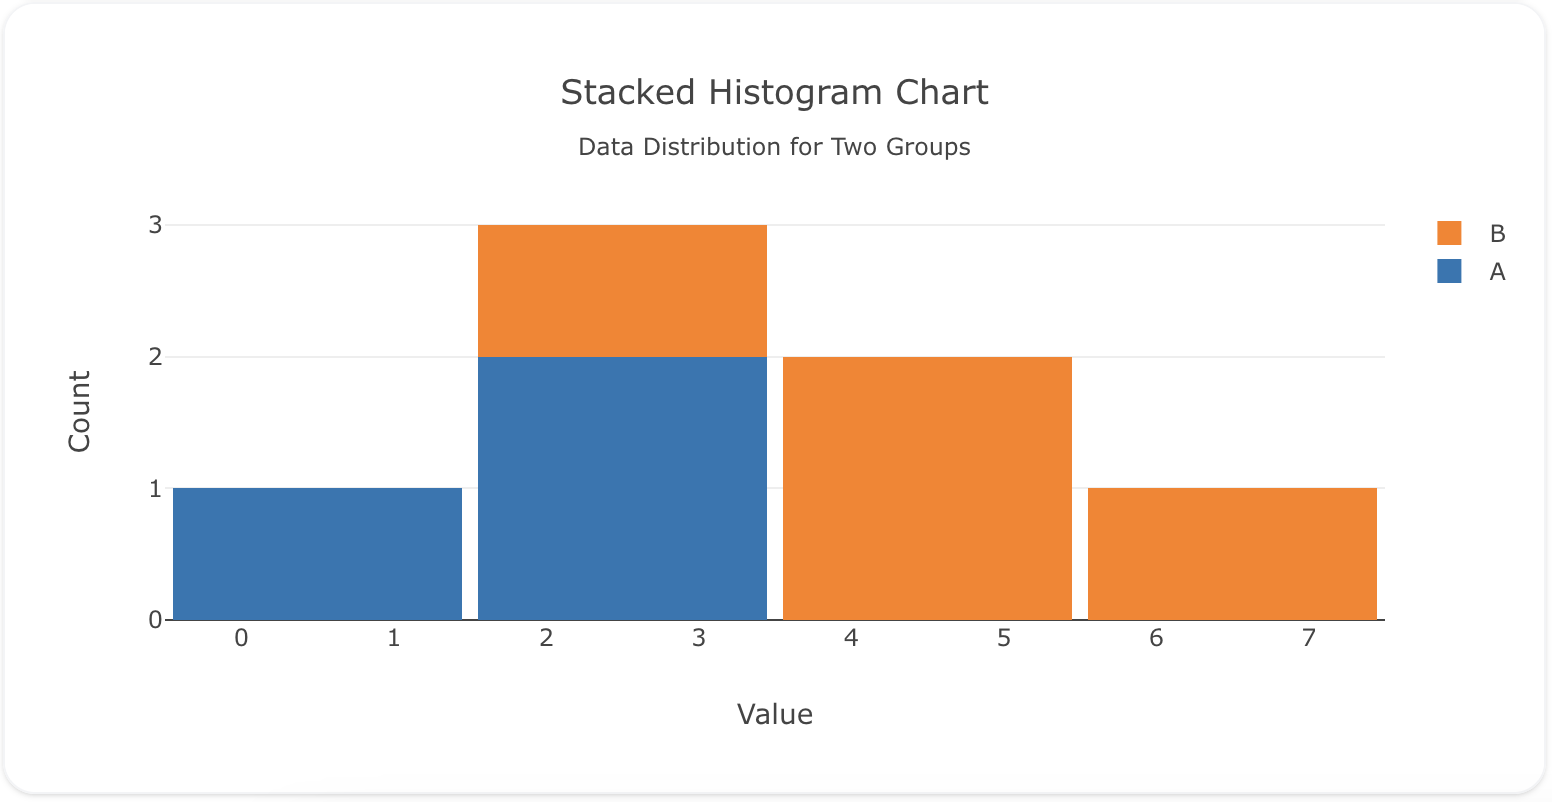
sources:
  - name: histogram-data-stacked-source
    type: duckdb
    database: target/seeds/histogram_data_stacked.duckdb
    seeds:
      - table_name: model
        args:
          - echo
          - |
            group,value
            A,1
            A,2
            A,2
            A,3
            B,3
            B,4
            B,5
            B,5
            B,6
models:
  - name: histogram-data-stacked
    source: ${ref(histogram-data-stacked-source)}
    sql: select * from model
insights:
  - name: Histogram Groups
    props:
      type: histogram
      x: ?{${ref(histogram-data-stacked).value}}
      marker:
        color: ?{case when ${ref(histogram-data-stacked).group} = 'A' then '#1f77b4' when ${ref(histogram-data-stacked).group} = 'B' then '#ff7f0e' else null end}
    interactions:
      - split: ?{${ref(histogram-data-stacked).group}}

charts:
  - name: Stacked Histogram Chart
    insights:
      - ${ref(Histogram Groups)}
    layout:
      title:
        text: Stacked Histogram Chart<br><sub>Data Distribution for Two Groups</sub>
      xaxis:
        title:
          text: "Value"
      yaxis:
        title:
          text: "Count"
      barmode: "stack"
      bargap: .05