Indicator
Overview
The indicator insight type is used to create key performance indicator (KPI) visualizations, allowing you to display single or aggregated values in a gauge or numeric format. Indicators are great for showing metrics like progress, performance, or key values at a glance.
You can customize the gauge, delta values, colors, and text annotations to represent your data effectively. Indicator plots are widely used in dashboards and reporting.
Common Uses
- KPI Dashboards: Displaying key metrics, progress, or performance indicators.
- Gauges: Visualizing values as a gauge to track goals or targets.
- Highlighting Change: Showing the difference between two points in time.
Check out the Attributes for the full set of configuration options
Examples
Common Configurations
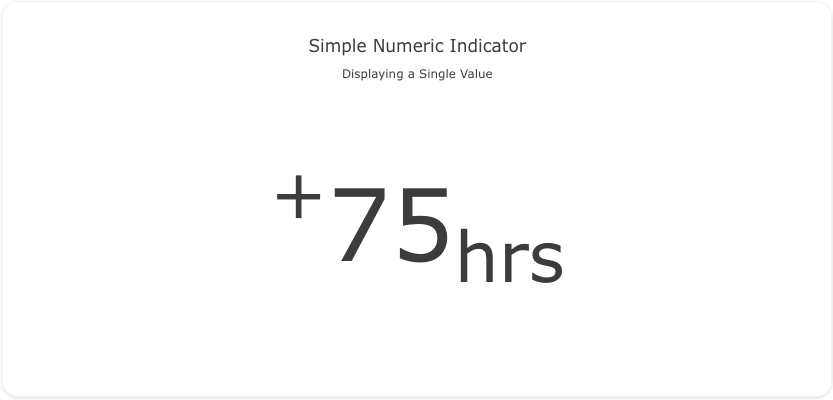
Here's a simple indicator insight displaying a single numeric value:
sources:
  - name: indicator-data-source
    type: duckdb
    database: target/seeds/indicator_data.duckdb
    seeds:
      - table_name: model
        args:
          - echo
          - |
            value
            75
models:
  - name: indicator-data
    source: ${ref(indicator-data-source)}
    sql: select * from model
insights:
  - name: Simple Numeric Indicator
    props:
      type: indicator
      mode: "number"
      value: ?{${ref(indicator-data).value}}[0]
      number:
        suffix: '<sub>hrs</sub>'
        prefix: ?{case when ${ref(indicator-data).value} > 0 then '<sup>+</sup>' else '<sup>-</sup>' end}[0]
        font:
          size: 100
charts:
  - name: Simple Numeric Indicator Chart
    insights:
      - ${ref(Simple Numeric Indicator)}
    layout:
      title:
        text: Simple Numeric Indicator<br><sub>Displaying a Single Value</sub>
    margin:
      l: 0
      r: 0
      b: 50
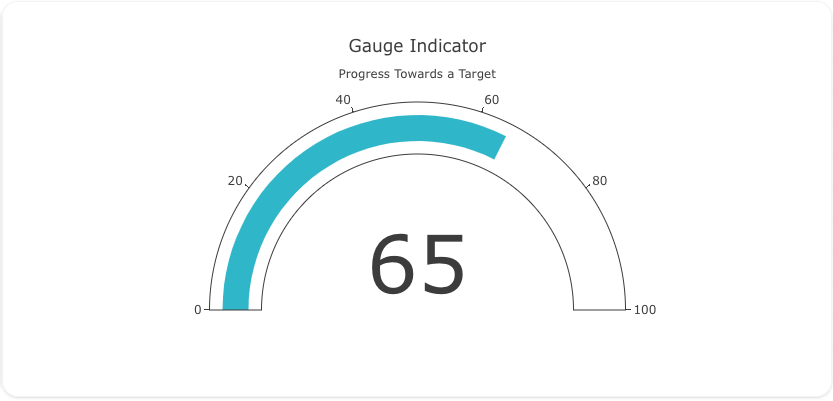
This example shows a gauge indicator to represent a value and its progress toward a goal:
sources:
  - name: indicator-data-gauge-source
    type: duckdb
    database: target/seeds/indicator_data_gauge.duckdb
    seeds:
      - table_name: model
        args:
          - echo
          - |
            value
            65
models:
  - name: indicator-data-gauge
    source: ${ref(indicator-data-gauge-source)}
    sql: select * from model
insights:
  - name: Gauge Indicator
    props:
      type: indicator
      mode: "gauge+number"
      value: ?{${ref(indicator-data-gauge).value}}[0]
      gauge:
        axis:
          range: [0, 100]
        bar:
          color: "#17becf"
charts:
  - name: Gauge Indicator Chart
    insights:
      - ${ref(Gauge Indicator)}
    layout:
      title:
        text: Gauge Indicator<br><sub>Progress Towards a Target</sub>
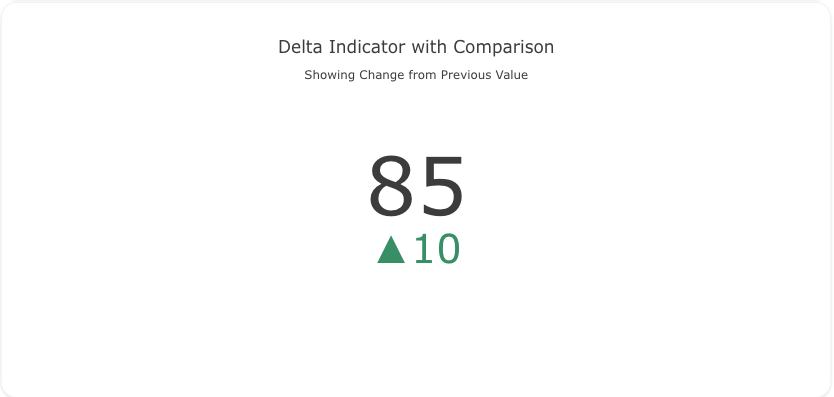
This example demonstrates an indicator insight with delta values, comparing the current value to a previous value:
sources:
  - name: indicator-data-delta-source
    type: duckdb
    database: target/seeds/indicator_data_delta.duckdb
    seeds:
      - table_name: model
        args:
          - echo
          - |
            sort,value
            3,85
            2,75
            1,65
            0,55
models:
  - name: indicator-data-delta
    source: ${ref(indicator-data-delta-source)}
    sql: select * from model
insights:
  - name: Delta Indicator with Comparison
    props:
      type: indicator
      mode: "number+delta"
      value: ?{${ref(indicator-data-delta).value}}[0]
      delta:
        reference: ?{${ref(indicator-data-delta).value}}[1]
    interactions:
      - sort: ?{${ref(indicator-data-delta).sort} desc}

charts:
  - name: Delta Indicator with Comparison Chart
    insights:
      - ${ref(Delta Indicator with Comparison)}
    layout:
      title:
        text: Delta Indicator with Comparison<br><sub>Showing Change from Previous Value</sub>