Isosurface
Overview
The isosurface insight type is used to create 3D isosurface visualizations, which represent a 3D volume using surfaces of constant values. Isosurfaces are commonly used in scientific visualization, such as fluid dynamics, medical imaging, or geospatial data, to show regions of interest within a 3D space.
You can customize the colors, opacity, and surface rendering to visualize 3D data effectively.
Common Uses
- Scientific Visualization: Representing surfaces of constant values in a 3D volume.
- Medical Imaging: Displaying 3D representations of structures, such as in MRI or CT scans.
- Geospatial and Engineering Data: Visualizing 3D volumes and their properties.
Check out the Attributes for the full set of configuration options
Examples
Common Configurations
Here's a simple isosurface insight showing a constant value surface within a 3D grid:
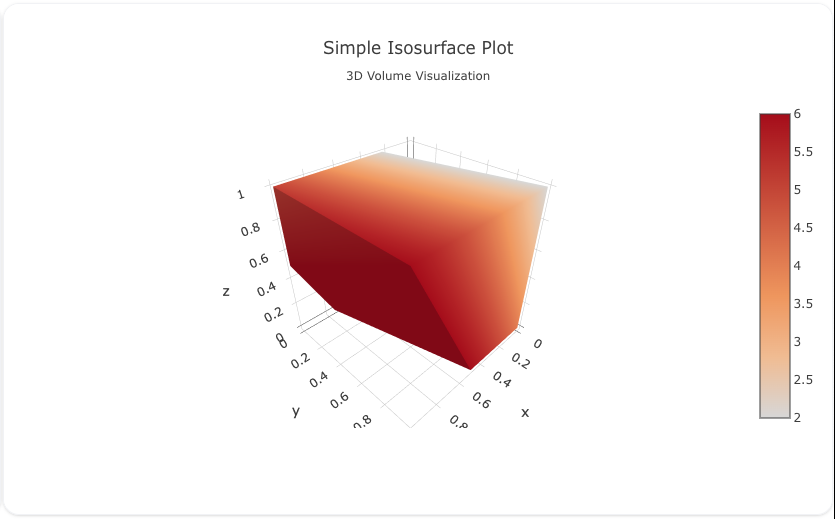
You can copy this code below to create this chart in your project:
sources:
  - name: isosurface-data-simple-source
    type: duckdb
    database: target/seeds/isosurface_data_simple.duckdb
    seeds:
      - table_name: model
        args:
          - echo
          - |
            idx,x,y,z,value
            0,0,0,1,1
            1,0,1,1,2
            2,0,0,0,3
            3,0,1,0,4
            4,1,0,1,5
            5,1,1,1,6
            6,1,0,0,7
            7,1,1,0,8

models:
  - name: isosurface-data-simple
    source: ${ref(isosurface-data-simple-source)}
    sql: select * from model
insights:
  - name: Simple Isosurface Plot Insight
    props:
      type: isosurface
      x: ?{${ref(isosurface-data-simple).x}}
      y: ?{${ref(isosurface-data-simple).y}}
      z: ?{${ref(isosurface-data-simple).z}}
      value: ?{${ref(isosurface-data-simple).value}}
      isomin: 2
      isomax: 6
      colorscale: "Reds"
    interactions:
      - sort: ?{${ref(isosurface-data-simple).idx} asc}


charts:
  - name: Simple Isosurface Chart
    insights:
      - ${ref(Simple Isosurface Plot Insight)}
    layout:
      title:
        text: Simple Isosurface Plot<br><sub>3D Volume Visualization</sub>
This example demonstrates a more complex isosurface insight with a slice and custom camera angle:
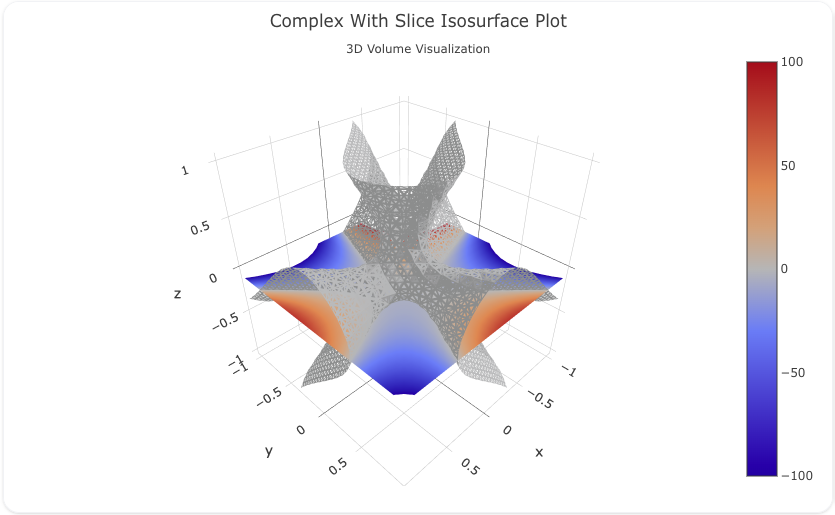
Here's the code:
sources:
  - name: isosurface-data-source
    type: duckdb
    database: target/seeds/isosurface_data.duckdb
    seeds:
      - table_name: model
        args:
          - curl
          - https://raw.githubusercontent.com/visivo-io/data/refs/heads/main/fractal-cubic.csv

models:
  - name: isosurface-data
    source: ${ref(isosurface-data-source)}
    sql: select * from model
insights:
  - name: Complex With Slice Isosurface Insight
    props:
      type: isosurface
      x: ?{${ref(isosurface-data).x}}
      y: ?{${ref(isosurface-data).y}}
      z: ?{${ref(isosurface-data).z}}
      value: ?{${ref(isosurface-data).value}}
      isomin: -100
      isomax: 100
      surface:
        show: true
        count: 1
        fill: .8
      slices:
        z:
          show: true
          locations: [-0.1]
      caps:
        x:
          show: false
        y:
          show: false
        z:
          show: false
    interactions:
      - sort: ?{${ref(isosurface-data).idx} asc}


charts:
  - name: Complex With Slice Isosurface Chart
    insights:
      - ${ref(Complex With Slice Isosurface Insight)}
    layout:
      title:
        text: Complex With Slice Isosurface Plot<br><sub>3D Volume Visualization</sub>
      margin:
        t: 50
        b: 20
      camera:
        eye:
          x: 1.86
          y: 0.61
          z: 0.98