Mesh3d
Overview
The mesh3d insight type is used to create 3D mesh plots, which visualize 3D surfaces defined by vertices and connections between them. Mesh plots are commonly used in 3D data visualization to represent geometric shapes, surfaces, and volumes.
You can customize the colors, vertex positions, and opacity to represent 3D data and geometries effectively.
Common Uses
- 3D Geometries: Visualizing surfaces and volumes in 3D space.
- Scientific Visualization: Representing complex 3D data in fields like physics, engineering, and geology.
- 3D Surface Rendering: Displaying 3D surfaces from a set of points and connectivity information.
Check out the Attributes for the full set of configuration options
Examples
Common Configurations
Here's a simple mesh3d insight visualizing a 3D mesh structure with vertices and connections:
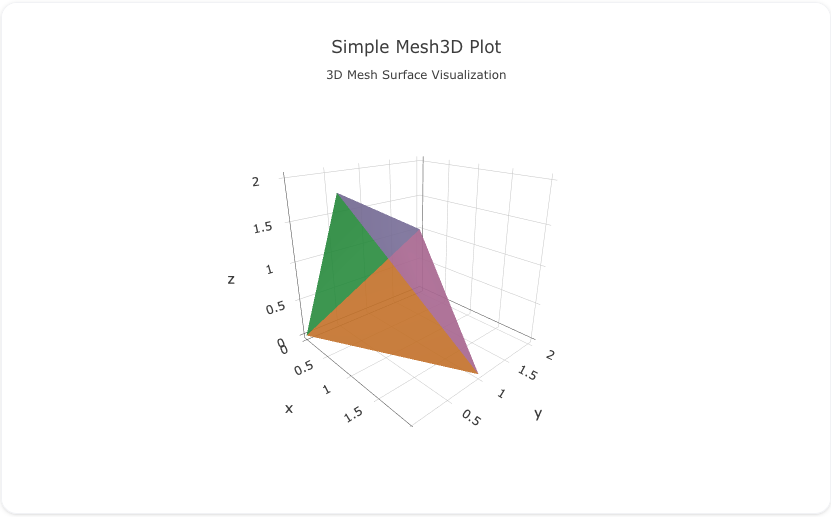
You can copy this code below to create this chart in your project:
sources:
  - name: mesh3d-data-source
    type: duckdb
    database: target/seeds/mesh3d_data.duckdb
    seeds:
      - table_name: model
        args:
          - echo
          - |
            idx,x,y,z,i,j,k,color
            0,0,0,0,0,1,2,#1f77b4
            1,1,0,2,0,2,3,#ff7f0e
            2,2,1,0,0,3,1,#2ca02c
            3,0,2,1,1,2,3,#9467bd

models:
  - name: mesh3d-data
    source: ${ref(mesh3d-data-source)}
    sql: select * from model
insights:
  - name: Simple Mesh3D Insight
    props:
      type: mesh3d
      x: ?{${ref(mesh3d-data).x}}
      y: ?{${ref(mesh3d-data).y}}
      z: ?{${ref(mesh3d-data).z}}
      i: ?{${ref(mesh3d-data).i}}
      j: ?{${ref(mesh3d-data).j}}
      k: ?{${ref(mesh3d-data).k}}
      facecolor: ?{${ref(mesh3d-data).color}}
      opacity: 0.7
    interactions:
      - sort: ?{${ref(mesh3d-data).idx} asc}


charts:
  - name: Simple Mesh3D Chart
    insights:
      - ${ref(Simple Mesh3D Insight)}
    layout:
      title:
        text: Simple Mesh3D Plot<br><sub>3D Mesh Surface Visualization</sub>