Scatter
Overview
The scatter insight type is used to create scatter plots, which visualize data points based on two numerical variables. Scatter plots are widely used for analyzing relationships between variables, identifying trends, and detecting outliers.
Gotchas
- Scatter insights are also used to generate area and line insights.
- The line connections of a scatter insight are determined by the
interactions.sortattribute. Make sure to set that to get a deterministic insight for lines and area permutations.
You can customize the marker size, color, and add lines to connect the points to represent the data in various forms like scatter plots, line charts, and more.
Common Uses
- Relationship Analysis: Exploring the relationship between two variables.
- Trend Detection: Identifying trends or patterns in data.
- Outlier Identification: Spotting outliers in data distributions.
Check out the Attributes for the full set of configuration options
Examples
Common Configurations
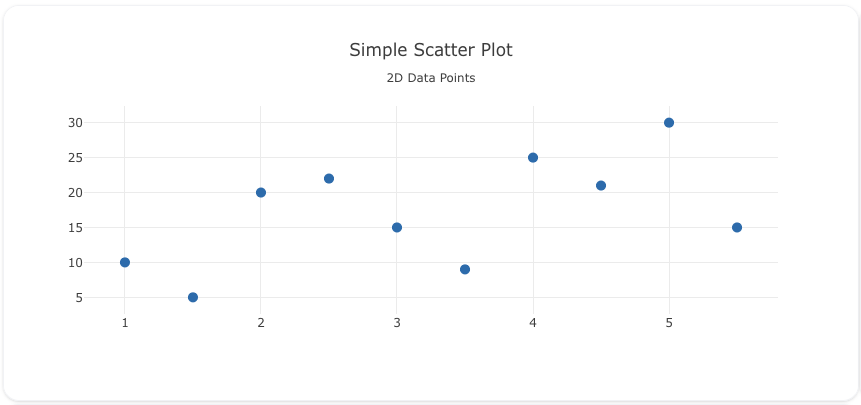
Here's a simple scatter insight showing data points on a 2D plane:
sources:
  - name: scatter-data-source
    type: duckdb
    database: target/seeds/scatter_data.duckdb
    seeds:
      - table_name: model
        args:
          - echo
          - |
            x,y
            1,10
            2,20
            3,15
            4,25
            5,30
            1.5,5
            2.5,22
            3.5,9
            4.5,21
            5.5,15

models:
  - name: scatter-data
    source: ${ref(scatter-data-source)}
    sql: select * from model
insights:
  - name: Simple Scatter Plot
    props:
      type: scatter
      x: ?{${ref(scatter-data).x}}
      y: ?{${ref(scatter-data).y}}
      mode: "markers"
      marker:
        size: 10
    interactions:
      - sort: ?{x ASC}
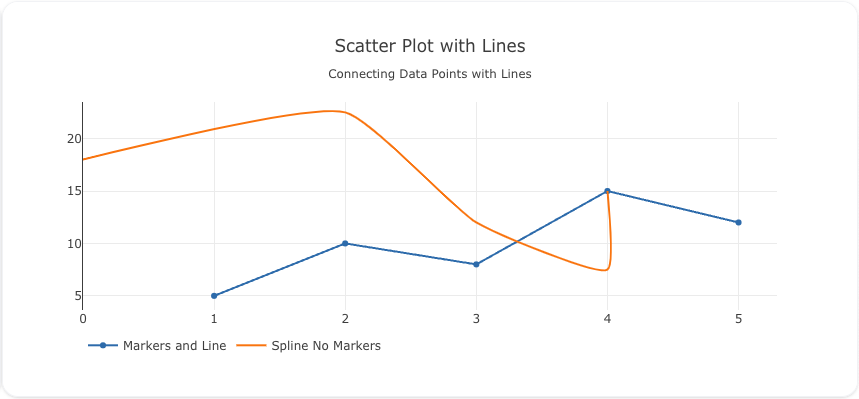
This example demonstrates a scatter insight with lines connecting the data points to show trends:
sources:
  - name: scatter-data-lines-source
    type: duckdb
    database: target/seeds/scatter_data_lines.duckdb
    seeds:
      - table_name: model
        args:
          - echo
          - |
            x,y
            1,5
            2,10
            3,8
            4,15
            5,12

models:
  - name: scatter-data-lines
    source: ${ref(scatter-data-lines-source)}
    sql: select * from model
insights:
  - name: Markers and Line
    props:
      type: scatter
      x: ?{${ref(scatter-data-lines).x}}
      y: ?{${ref(scatter-data-lines).y}}
      mode: "lines+markers"
    interactions:
      - sort: ?{x ASC}

  - name: Spline No Markers
    props:
      type: scatter
      x: ?{${ref(scatter-data-lines).x}+3 - (${ref(scatter-data-lines).x}*${ref(scatter-data-lines).x})/3}
      y: ?{${ref(scatter-data-lines).y}*1.5}
      mode: "lines"
      line:
        shape: spline
        smoothing: .5 #Sets spline bend
    interactions:
      - sort: ?{x ASC}
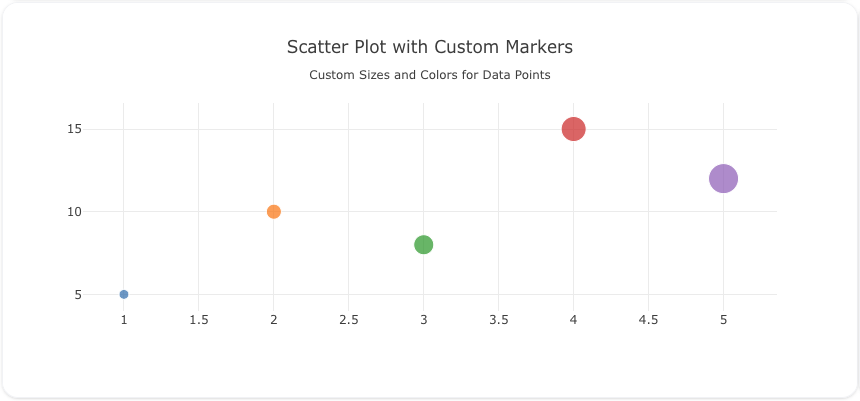
Here's a scatter insight with custom marker sizes and colors, giving more visual weight to each data point:
sources:
  - name: scatter-data-custom-source
    type: duckdb
    database: target/seeds/scatter_data_custom.duckdb
    seeds:
      - table_name: model
        args:
          - echo
          - |
            x,y,size,color
            1,5,10,#1f77b4
            2,10,15,#ff7f0e
            3,8,20,#2ca02c
            4,15,25,#d62728
            5,12,30,#9467bd

models:
  - name: scatter-data-custom
    source: ${ref(scatter-data-custom-source)}
    sql: select * from model
insights:
  - name: Scatter Plot with Custom Markers
    props:
      type: scatter
      x: ?{${ref(scatter-data-custom).x}}
      y: ?{${ref(scatter-data-custom).y}}
      mode: "markers"
      marker:
        size: ?{${ref(scatter-data-custom).size}}
        color: ?{${ref(scatter-data-custom).color}}
    interactions:
      - sort: ?{x ASC}
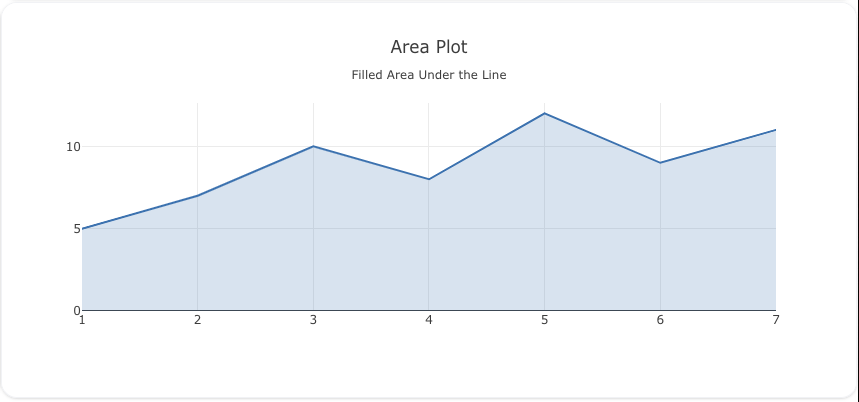
Here's a scatter insight used to create an area plot, filling the area under the line:
sources:
  - name: area-plot-data-source
    type: duckdb
    database: target/seeds/area_plot_data.duckdb
    seeds:
      - table_name: model
        args:
          - echo
          - |
            x,y
            1,5
            2,7
            3,10
            4,8
            5,12
            6,9
            7,11

models:
  - name: area-plot-data
    source: ${ref(area-plot-data-source)}
    sql: select * from model
insights:
  - name: Area Plot
    props:
      type: scatter
      x: ?{${ref(area-plot-data).x}}
      y: ?{${ref(area-plot-data).y}}
      mode: "lines"
      fill: "tozeroy"
      fillcolor: "rgba(55, 126, 184, 0.2)"
      line:
        color: "rgb(55, 126, 184)"
        width: 2
    interactions:
      - sort: ?{x ASC}