Chart
Overview
Charts enable you to combine one or more traces with layout configurations (titles, axis labels, ect.).
Tip
You can add traces of different types to a chart. For example, you may want to display an indicator
on top of a bar to show how what the bars add up to.
You can also configure interactivity in your charts by setting up a selector.
Common Configurations
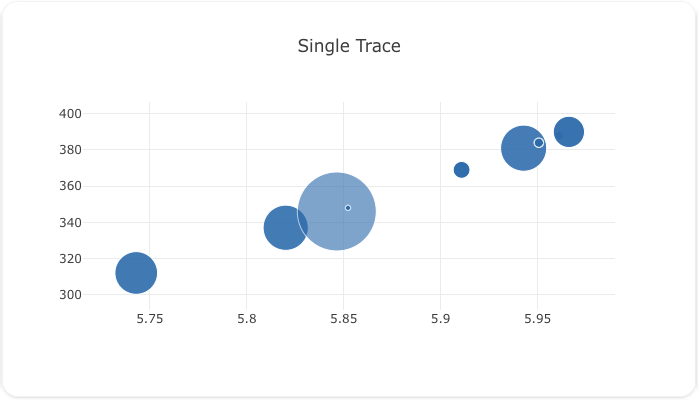
Single Trace
This is the most common and simplest chart setup. You will use this when you want to display a single trace.
Single Trace
Code
models:
  - name: Array of Numbers
    args: ["curl", "-s", "https://raw.githubusercontent.com/visivo-io/data/refs/heads/main/y_values.csv"]

traces:
  - name: Simple Scatter
    model: ref(Array of Numbers)
    props:
      type: scatter
      x: ?{ ln(numbers_column)}
      y: ?{numbers_column}
      mode: markers
      marker:
        size: ?{ abs(sin(exp(numbers_column) - 5)*100) }
        opacity: ?{ abs(cos(exp(numbers_column) - 5)*100)/100 }
    filters:
      - ?{ numbers_column < 400 }
    order_by:
      - ?{numbers_column}

charts:
  - name: Single Trace Chart
    traces:
      - ref(Simple Scatter)
    layout:
      title:
        text: "Single Trace"
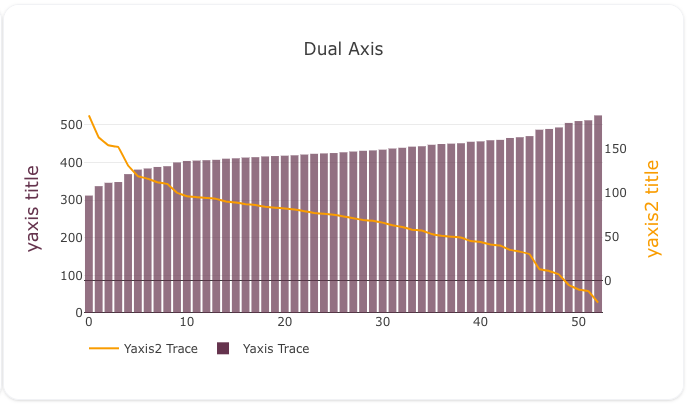
Duel Axis
When you want to display two different types of data on the same chart, duel axis can come in handy.
Tip
You can actually create a third, and fourth axis (see plotly docs), however, we do not recommended using more than two yaxes.
Here's a working example that you can copy and paste into your project:
Duel Y Axes
Code
models:
  - name: Series of Numbers
    args: ["curl", "-s", "https://raw.githubusercontent.com/visivo-io/data/refs/heads/main/y_values.csv"]

traces:
  - name: Yaxis Trace
    model: ref(Series of Numbers)
    props:
      type: bar
      y: ?{numbers_column}
      marker:
        color: '#713B57'
        opacity: .7
    order_by:
      - ?{numbers_column}

  - name: Yaxis2 Trace
    model: ref(Series of Numbers)
    props:
      type: scatter
      y: ?{ (500 -  numbers_column) }
      yaxis: 'y2'
      line:
        shape: spline
        smoothing: .1
        color: orange

    order_by:
      - ?{numbers_column}

charts:
  - name: Duel Axis
    traces:
      - ref(Yaxis2 Trace)
      - ref(Yaxis Trace)
    layout:
      title:
        text: "Dual Axis"
      legend:
        orientation: "h"
      yaxis:
        title:
          text: "yaxis title"
          font:
            size: 18
            color: '#713B57'
      yaxis2:
        title:
          text: "yaxis2 title"
          font:
            size: 18
            color: orange
        side: right
        overlaying: 'y'
        anchor: 'y'
        showgrid: false
Position Traces with Domains
You can use domains to position traces on your chart. This is useful when you want to display multiple traces on your chart.
The domain attribute in the trace props enables you to position your traces relative to 0,0 coordinates of the chart.
Here's some working examples that you can copy and paste into your project:
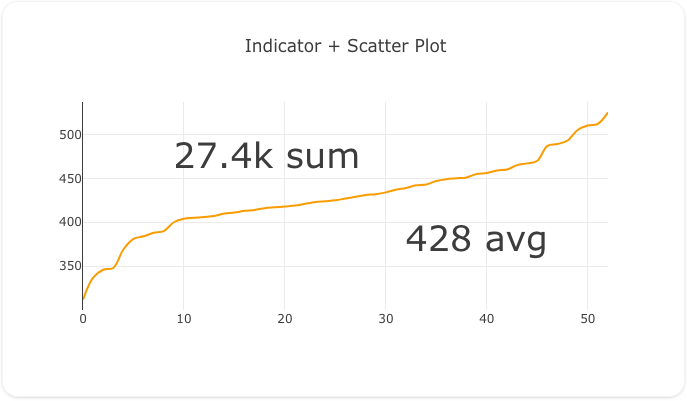
Trend Line + Multiple Indicators
Code
models:
  - name: Numbers From Remote CSV
    args: ["curl", "-s", "https://raw.githubusercontent.com/visivo-io/data/refs/heads/main/y_values.csv"]

traces:
  - name: Line Trace
    model: ref(Numbers From Remote CSV)
    props:
      type: scatter
      y: ?{numbers_column}
      line:
        shape: spline
        color: orange

  - name: Average Value
    model: ref(Numbers From Remote CSV)
    columns:
      avg_numbers_column: avg(numbers_column)
    props:
      type: indicator
      value: column(avg_numbers_column)[0]
      number:
        font:
          size: 35
        suffix: " avg"
      domain:
        y: [0, .7]
        x: [.5, 1]

  - name: Total Value
    model: ref(Numbers From Remote CSV)
    columns:
      sum_numbers_column: sum(numbers_column)
    props:
      type: indicator
      value: column(sum_numbers_column)[0]
      number:
        font:
          size: 35
        suffix: " sum"
      domain:
        y: [.5, 1]
        x: [.2, .5]

charts:
  - name: Big Number Over Line Chart
    traces:
      - ref(Average Value)
      - ref(Total Value)
      - ref(Line Trace)
    layout:
      title:
        text: "Indicator + Scatter Plot"
Attributes
| Field | Type | Default | Description |
|---|---|---|---|
| path | string | None | A unique path to this object |
| name | string | None | The unique name of the object across the entire project. |
| file_path | string | None | The path to the file that contains the object definition. |
| selector | Any of: Selector, string or string | None | The selector for the choosing which trace data is shown. |
| traces | Array of Trace | [] | A list of traces either written in line in the chart or called using the ref() function. Supports both for backward compatibility and future interactivity features. |
| insights | Array of Insight | [] | A list of insights either written in line in the chart or called using the ref() function. Supports both for backward compatibility and future interactivity features. |
| layout | Layout | None | A layout configuration that must adhere to the layout.schema.json file. |