How Visivo Works
When you work with Visivo, you write YAML configurations and run a few CLI commands. Visivo handles everything else automatically so you and your team can focus on what matters. The walkthrough below isn't exactly what happens under the hood, but it's a solid approximation.
Say you have a model called widget_sales that looks like this:
| widget | quantity | completed_at |
|---|---|---|
| Useful Widget | 300 | 2023-01-01 |
| Useful Widget | 250 | 2023-01-07 |
| Useful Widget | 150 | 2023-01-08 |
| Expensive Widget | 900 | 2023-01-02 |
| Expensive Widget | 50 | 2023-01-03 |
| Expensive Widget | 50 | 2023-01-09 |
You can declare an insight in any *.visivo.yml file in your project. The insight binds plotly props to the columns of one or more models using ?{ ... } slot expressions and ${ref(model).column} field references:
models:
- name: widget_sales
sql: select * from widget_sales
insights:
- name: weekly_widget_sales
props:
type: scatter
mode: lines
x: ?{ date_trunc('week', ${ref(widget_sales).completed_at}) }
y: ?{ sum(${ref(widget_sales).quantity}) }
marker:
color: ?{ case when sum(${ref(widget_sales).quantity}) > 200 then 'green' else 'blue' end }
interactions:
- split: ?{${ref(widget_sales).widget}}
charts:
- name: simple_chart
insights:
- ${ref(weekly_widget_sales)}
layout:
title:
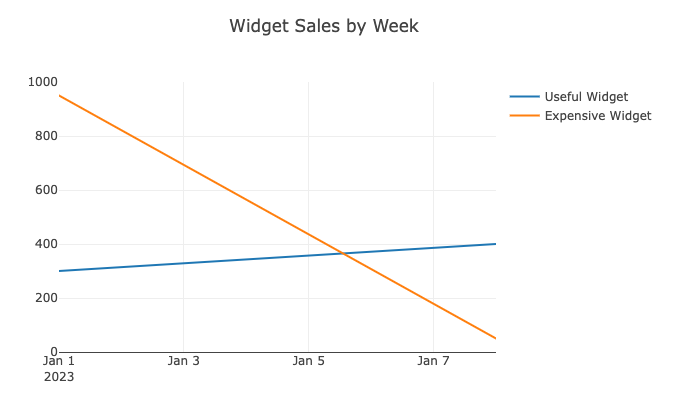
text: Widget Sales by Week
insights:
  - name: weekly_widget_sales
    props:
      type: scatter
      mode: lines
      x: ?{ date_trunc('week', ${ref(widget_sales).completed_at}) }
      y: ?{ sum(${ref(widget_sales).quantity}) }
      marker:
        color: ?{ case when sum(${ref(widget_sales).quantity}) > 200 then 'green' else 'blue' end }
    interactions:
      - split: ?{${ref(widget_sales).widget}}

charts:
  - name: simple_chart
    insights:
      - ${ref(weekly_widget_sales)}
    layout:
      title:
        text: Widget Sales by Week

models:
  - name: widget_sales
    description: "A table containing widget sales sourced from the CRM"
    columns:
      - name: widget
        description: The type of widget sold
      - name: quantity
        description: The number of widgets sold
      - name: completed_at
        description: Timestamp of when the transaction occurred
Where the dbt model itself is defined like this:
SELECT
  widget,
  quantity,
  completed_at
FROM {{ source('crm', 'sales_of_widgets') }}
Compile
visivo compile parses your YAML, validates the project against the JSON schema, and writes target/project.json plus per-insight metadata. The ?{ ... } slots and ${ref(...)} references are resolved into a SQL query that the source can execute, captured in the insight's metadata file.
Run
visivo run executes the model query against your source and writes a Parquet file per insight to target/<run-id>/files/<insight-name>.parquet. It also writes an insights/<insight-name>.json describing the prop-to-column mapping and any post-query (the part that runs client-side in the browser).
widget,         x,           y,    marker.color
Useful Widget,  2023-01-01,  300,  green
Useful Widget,  2023-01-08,  400,  green
Expensive Widget, 2023-01-01, 950, green
Expensive Widget, 2023-01-08,  50, blue
Render
When the dashboard is opened in the browser, the Visivo viewer loads the Parquet file with DuckDB-WASM, applies any interactions (split, sort, filter) client-side, maps the result columns onto the insight's plotly props, and hands the assembled series data to plotly to render.
That same insight can now be reused across as many charts and dashboards as you like — Visivo computes the underlying data exactly once.