Dashboard
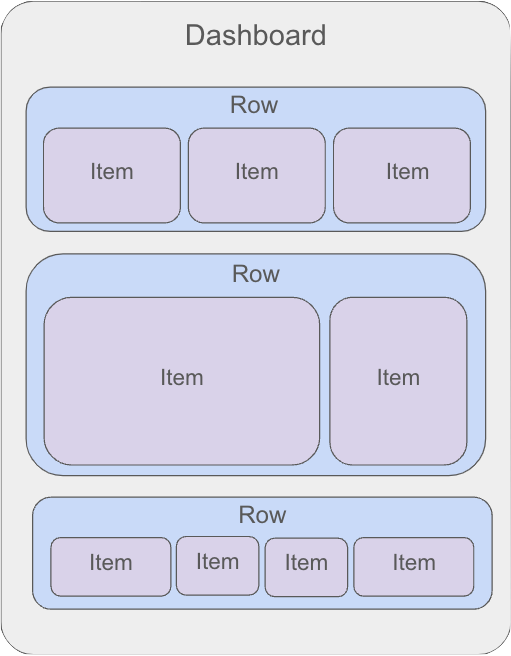
Dashboards are lists of rows that enable you to build your dashboard grid.
Tip
By leveraging visivo serve while building you can quickly optimize your layout. Simply re-size your row heights and item widths, save the file and quickly see the new layout of your dashboard on localhost:8000.
Within the rows you are able to organize and display charts, tables, selectors and markdown from your project as items.
Note
visivo.project.yml
dashboards:
  - name: Layout Example
    rows:
      - height: medium
        items: #item.width default is 1
          - chart: ...
          - chart: ...
          - chart: ...
      - height: large
        items:
          - width: 2
            table: ...
          - width: 1
            markdown: ...
      - height: small
        items:
          - width: 2
            selector: ...
          - chart: ...
          - chart: ...
          - width: 2
            chart: ...
Above you can see how changing the row heights and item widths impacts the layout of the dashboard.
Example
row.height defaults to medium and item.width defaults to 1. Specifying those fields are optional if you want to use the default values
dashboards:
  - name: any-name-you-want  #unique name of your dashboard
    rows:
      - height: medium
        items:
          - width: 2  #widths are evaluated relative to other items in the row
            table: ref(a-table-name)
          - width 1  #this chart will be 1/3 of the row
            chart: ref(a-chart-name)
      - height: small
        items:
          - markdown: "# Some inline **markdown**"
          - chart: ref(another-chart)
          - width: 2
            chart: ref(a-third-chart)
Attributes
| Field | Type | Default | Description |
|---|---|---|---|
| path | string | None | A unique path to this object |
| name | string | None | The unique name of the object across the entire project. |
| rows | Array of Row | [] | A list of Row objects |