Box
Overview
The box trace type is used to display data as a box plot, which shows the distribution of data based on their quartiles, medians, and potential outliers. It's useful for statistical visualizations, as it highlights data spread and central tendency while accounting for variability.
You can control various aspects of the plot, such as the orientation, box and whisker styles, marker symbols, and points display. Additionally, you can show or hide outliers and configure hover labels for enhanced interaction.
Common Uses
- Distribution Analysis: Understanding the distribution of quest-related data.
- Outlier Detection: Identifying outliers in quest performance metrics.
- Comparative Analysis: Comparing the performance of knights on different quests.
Check out the Attributes for the full set of configuration options
Examples
Common Configurations
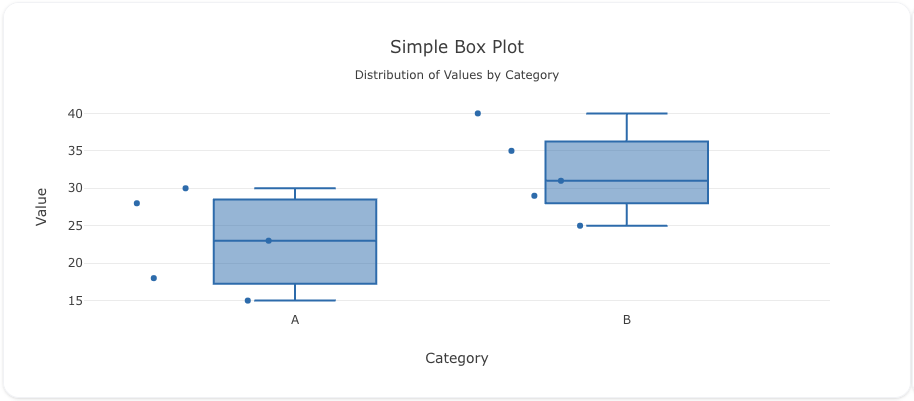
Here's a simple box plot showing the distribution of sample data:
You can copy this code below to create this chart in your project:
models:
  - name: sample-data
    args:
      - echo
      - |
        category,value
        A,23
        A,15
        A,18
        A,30
        A,28
        B,40
        B,35
        B,31
        B,25
        B,29
traces:
  - name: Sample Box Plot
    model: ${ref(sample-data)}
    props:
      type: box
      x: ?{category}
      y: ?{value}
      boxpoints: "all"
      jitter: 1
      pointpos: -1.1
charts:
  - name: Sample Box Plot Chart
    traces:
      - ${ref(Sample Box Plot)}
    layout:
      title:
        text: Simple Box Plot<br><sub>Distribution of Values by Category</sub>
      xaxis:
        title:
          text: "Category"
      yaxis:
        title:
          text: "Value"
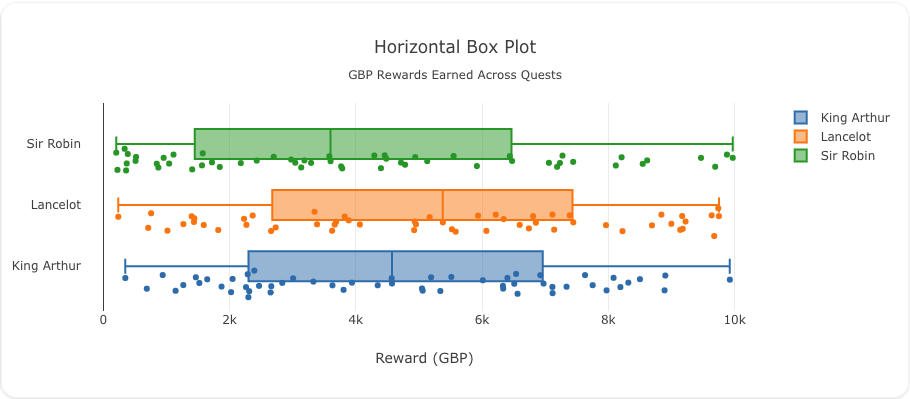
Here's a box plot showing the distribution of rewards earned by knights across different quests:
You can copy this code below to create this chart in your project:
models:
  - name: monty-python-quest-data-unique
    args:
      - curl
      - "https://raw.githubusercontent.com/visivo-io/data/refs/heads/main/monty_python_quests.csv"
traces:
  - name: Rewards Distribution by Quest
    model: ${ref(monty-python-quest-data-unique)}
    cohort_on: "person"
    props:
      type: box
      y: ?{person}
      x: ?{reward_gbp}
      boxpoints: "all"
      jitter: 1
      pointpos: -1.1
      orientation: h
charts:
  - name: Rewards Distribution Box Plot
    traces:
      - ${ref(Rewards Distribution by Quest)}
    layout:
      title:
        text: Horizontal Box Plot<br><sub>GBP Rewards Earned Across Quests</sub>
      xaxis:
        title:
          text: "Reward (GBP)"
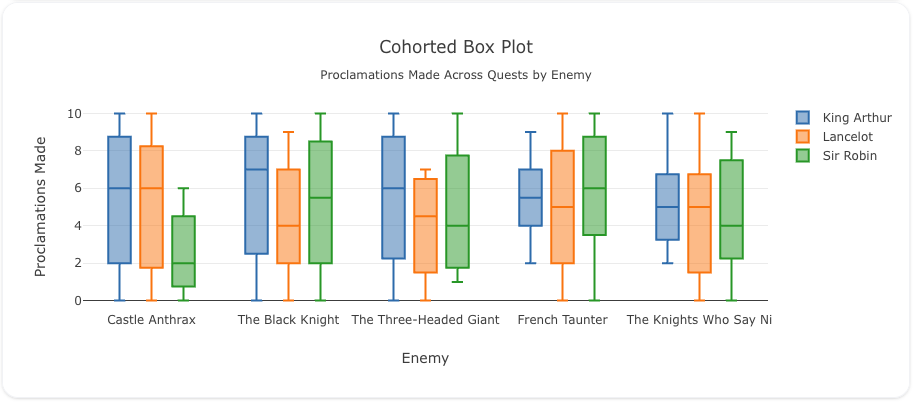
In this example, we show how to display a box plot for the number of proclamations mades:
Here's the code:
models:
  - name: monty-python-quest-proclamations
    args:
      - curl
      - "https://raw.githubusercontent.com/visivo-io/data/refs/heads/main/monty_python_quests.csv"
traces:
  - name: Proclamations Box Plot
    model: ${ref(monty-python-quest-proclamations)}
    cohort_on: "person"
    props:
      type: box
      y: ?{proclamations_made}
      x: ?{enemy_encountered}

charts:
  - name: Proclamations Box Plot with Outliers
    traces:
      - ${ref(Proclamations Box Plot)}
    layout:
      title:
        text: Cohorted Box Plot<br><sub>Proclamations Made Across Quests by Enemy</sub>
      xaxis:
        title:
          text: "Enemy"
      boxmode: group
      yaxis:
        title:
          text: "Proclamations Made"
A schema to validate plotly trace properties
Attributes
These attributes apply to traces where trace.props.type is set to box. You would configure these attributes on the trace with the trace.props object.
alignmentgroup: 'string' #(1)!
boxmean: 'any' #(2)!
boxpoints: 'any' #(3)!
customdata: 'array' #(4)!
customdatasrc: 'string' #(5)!
dx: 'number' #(6)!
dy: 'number' #(7)!
fillcolor: 'any' #(8)!
hoverinfo: 'array' #(9)!
hoverinfosrc: 'string' #(10)!
hoverlabel:
  align: 'array' #(11)!
  alignsrc: 'string' #(12)!
  bgcolor: 'color | array' #(13)!
  bgcolorsrc: 'string' #(14)!
  bordercolor: 'color | array' #(15)!
  bordercolorsrc: 'string' #(16)!
  font:
    color: color | array
    colorsrc: 'string' #(17)!
    family: 'string | array' #(18)!
    familysrc: 'string' #(19)!
    lineposition: 'array' #(20)!
    linepositionsrc: 'string' #(21)!
    shadow: 'string | array' #(22)!
    shadowsrc: 'string' #(23)!
    size: number | array
    sizesrc: 'string' #(24)!
    style: 'array' #(25)!
    stylesrc: 'string' #(26)!
    textcase: 'array' #(27)!
    textcasesrc: 'string' #(28)!
    variant: 'array' #(29)!
    variantsrc: 'string' #(30)!
    weight: 'integer | array' #(31)!
    weightsrc: 'string' #(32)!
  namelength: 'integer | array' #(33)!
  namelengthsrc: 'string' #(34)!
hoveron: 'string' #(35)!
hovertemplate: 'string | array' #(36)!
hovertemplatesrc: 'string' #(37)!
hovertext: 'string | array' #(38)!
hovertextsrc: 'string' #(39)!
ids: 'array' #(40)!
idssrc: 'string' #(41)!
jitter: 'number' #(42)!
legend: 'string' #(43)!
legendgroup: 'string' #(44)!
legendgrouptitle:
  font:
    color: any
    family: 'string' #(45)!
    lineposition: 'string' #(46)!
    shadow: 'string' #(47)!
    size: number
    style: 'any' #(48)!
    textcase: 'any' #(49)!
    variant: 'any' #(50)!
    weight: 'integer' #(51)!
  text: 'string' #(52)!
legendrank: 'number' #(53)!
legendwidth: 'number' #(54)!
line:
  color: 'any' #(55)!
  width: 'number' #(56)!
lowerfence: 'array' #(57)!
lowerfencesrc: 'string' #(58)!
marker:
  angle: 'number' #(59)!
  color: 'any' #(60)!
  line:
    color: 'any' #(61)!
    outliercolor: 'any' #(62)!
    outlierwidth: 'number' #(63)!
    width: 'number' #(64)!
  opacity: 'number' #(65)!
  outliercolor: 'any' #(66)!
  size: 'number' #(67)!
  symbol: 'any' #(68)!
mean: 'array' #(69)!
meansrc: 'string' #(70)!
median: 'array' #(71)!
mediansrc: 'string' #(72)!
metasrc: 'string' #(73)!
name: 'string' #(74)!
notched: 'boolean' #(75)!
notchspan: 'array' #(76)!
notchspansrc: 'string' #(77)!
notchwidth: 'number' #(78)!
offsetgroup: 'string' #(79)!
opacity: 'number' #(80)!
orientation: 'any' #(81)!
pointpos: 'number' #(82)!
q1: 'array' #(83)!
q1src: 'string' #(84)!
q3: 'array' #(85)!
q3src: 'string' #(86)!
quartilemethod: 'any' #(87)!
sd: 'array' #(88)!
sdmultiple: 'number' #(89)!
sdsrc: 'string' #(90)!
selected:
  marker:
    color: 'any' #(91)!
    opacity: 'number' #(92)!
    size: 'number' #(93)!
showlegend: 'boolean' #(94)!
showwhiskers: 'boolean' #(95)!
sizemode: 'any' #(96)!
stream:
  maxpoints: 'number' #(97)!
  token: 'string' #(98)!
text: 'string | array' #(99)!
textsrc: 'string' #(100)!
type: box
uid: 'string' #(101)!
unselected:
  marker:
    color: 'any' #(102)!
    opacity: 'number' #(103)!
    size: 'number' #(104)!
upperfence: 'array' #(105)!
upperfencesrc: 'string' #(106)!
visible: 'any' #(107)!
whiskerwidth: 'number' #(108)!
width: 'number' #(109)!
x: 'array' #(110)!
xaxis: 'string' #(111)!
xcalendar: 'any' #(112)!
xhoverformat: 'string' #(113)!
xperiodalignment: 'any' #(114)!
xsrc: 'string' #(115)!
y: 'array' #(116)!
yaxis: 'string' #(117)!
ycalendar: 'any' #(118)!
yhoverformat: 'string' #(119)!
yperiodalignment: 'any' #(120)!
ysrc: 'string' #(121)!
zorder: 'integer' #(122)!
- Set several traces linked to the same position axis or matching axes to the same alignmentgroup. This controls whether bars compute their positional range dependently or independently.
- If true, the mean of the box(es)' underlying distribution is drawn as a dashed line inside the box(es). If sd the standard deviation is also drawn. Defaults to true when
meanis set. Defaults to sd whensdis set Otherwise defaults to false. - If outliers, only the sample points lying outside the whiskers are shown If suspectedoutliers, the outlier points are shown and points either less than 4Q1-3Q3 or greater than 4Q3-3Q1 are highlighted (see
outliercolor) If all, all sample points are shown If false, only the box(es) are shown with no sample points Defaults to suspectedoutliers whenmarker.outliercolorormarker.line.outliercoloris set. Defaults to all under the q1/median/q3 signature. Otherwise defaults to outliers. - Assigns extra data each datum. This may be useful when listening to hover, click and selection events. Note that, scatter traces also appends customdata items in the markers DOM elements
- Sets the source reference on Chart Studio Cloud for
customdata. - Sets the x coordinate step for multi-box traces set using q1/median/q3.
- Sets the y coordinate step for multi-box traces set using q1/median/q3.
- Sets the fill color. Defaults to a half-transparent variant of the line color, marker color, or marker line color, whichever is available.
- Determines which trace information appear on hover. If
noneorskipare set, no information is displayed upon hovering. But, ifnoneis set, click and hover events are still fired. - Sets the source reference on Chart Studio Cloud for
hoverinfo. - Sets the horizontal alignment of the text content within hover label box. Has an effect only if the hover label text spans more two or more lines
- Sets the source reference on Chart Studio Cloud for
align. - Sets the background color of the hover labels for this trace
- Sets the source reference on Chart Studio Cloud for
bgcolor. - Sets the border color of the hover labels for this trace.
- Sets the source reference on Chart Studio Cloud for
bordercolor. - Sets the source reference on Chart Studio Cloud for
color. - HTML font family - the typeface that will be applied by the web browser. The web browser can only apply a font if it is available on the system where it runs. Provide multiple font families, separated by commas, to indicate the order in which to apply fonts if they aren't available.
- Sets the source reference on Chart Studio Cloud for
family. - Sets the kind of decoration line(s) with text, such as an under, over or through as well as combinations e.g. under+over, etc.
- Sets the source reference on Chart Studio Cloud for
lineposition. - Sets the shape and color of the shadow behind text. auto places minimal shadow and applies contrast text font color. See https://developer.mozilla.org/en-US/docs/Web/CSS/text-shadow for additional options.
- Sets the source reference on Chart Studio Cloud for
shadow. - Sets the source reference on Chart Studio Cloud for
size. - Sets whether a font should be styled with a normal or italic face from its family.
- Sets the source reference on Chart Studio Cloud for
style. - Sets capitalization of text. It can be used to make text appear in all-uppercase or all-lowercase, or with each word capitalized.
- Sets the source reference on Chart Studio Cloud for
textcase. - Sets the variant of the font.
- Sets the source reference on Chart Studio Cloud for
variant. - Sets the weight (or boldness) of the font.
- Sets the source reference on Chart Studio Cloud for
weight. - Sets the default length (in number of characters) of the trace name in the hover labels for all traces. -1 shows the whole name regardless of length. 0-3 shows the first 0-3 characters, and an integer >3 will show the whole name if it is less than that many characters, but if it is longer, will truncate to
namelength - 3characters and add an ellipsis. - Sets the source reference on Chart Studio Cloud for
namelength. - Do the hover effects highlight individual boxes or sample points or both?
- Template string used for rendering the information that appear on hover box. Note that this will override
hoverinfo. Variables are inserted using %{variable}, for example "y: %{y}" as well as %{xother}, {%xother}, {%_xother}, {%xother_}. When showing info for several points, xother will be added to those with different x positions from the first point. An underscore before or after (x|y)other will add a space on that side, only when this field is shown. Numbers are formatted using d3-format's syntax %{variable:d3-format}, for example "Price: %{y:$.2f}". https://github.com/d3/d3-format/tree/v1.4.5#d3-format for details on the formatting syntax. Dates are formatted using d3-time-format's syntax %{variable|d3-time-format}, for example "Day: %{2019-01-01|%A}". https://github.com/d3/d3-time-format/tree/v2.2.3#locale_format for details on the date formatting syntax. The variables available inhovertemplateare the ones emitted as event data described at this link https://plotly.com/javascript/plotlyjs-events/#event-data. Additionally, every attributes that can be specified per-point (the ones that arearrayOk: true) are available. Anything contained in tag<extra>is displayed in the secondary box, for example "{fullData.name} ". To hide the secondary box completely, use an empty tag<extra></extra>. - Sets the source reference on Chart Studio Cloud for
hovertemplate. - Same as
text. - Sets the source reference on Chart Studio Cloud for
hovertext. - Assigns id labels to each datum. These ids for object constancy of data points during animation. Should be an array of strings, not numbers or any other type.
- Sets the source reference on Chart Studio Cloud for
ids. - Sets the amount of jitter in the sample points drawn. If 0, the sample points align along the distribution axis. If 1, the sample points are drawn in a random jitter of width equal to the width of the box(es).
- Sets the reference to a legend to show this trace in. References to these legends are legend, legend2, legend3, etc. Settings for these legends are set in the layout, under
layout.legend,layout.legend2, etc. - Sets the legend group for this trace. Traces and shapes part of the same legend group hide/show at the same time when toggling legend items.
- HTML font family - the typeface that will be applied by the web browser. The web browser can only apply a font if it is available on the system where it runs. Provide multiple font families, separated by commas, to indicate the order in which to apply fonts if they aren't available.
- Sets the kind of decoration line(s) with text, such as an under, over or through as well as combinations e.g. under+over, etc.
- Sets the shape and color of the shadow behind text. auto places minimal shadow and applies contrast text font color. See https://developer.mozilla.org/en-US/docs/Web/CSS/text-shadow for additional options.
- Sets whether a font should be styled with a normal or italic face from its family.
- Sets capitalization of text. It can be used to make text appear in all-uppercase or all-lowercase, or with each word capitalized.
- Sets the variant of the font.
- Sets the weight (or boldness) of the font.
- Sets the title of the legend group.
- Sets the legend rank for this trace. Items and groups with smaller ranks are presented on top/left side while with reversed
legend.traceorderthey are on bottom/right side. The default legendrank is 1000, so that you can use ranks less than 1000 to place certain items before all unranked items, and ranks greater than 1000 to go after all unranked items. When having unranked or equal rank items shapes would be displayed after traces i.e. according to their order in data and layout. - Sets the width (in px or fraction) of the legend for this trace.
- Sets the color of line bounding the box(es).
- Sets the width (in px) of line bounding the box(es).
- Sets the lower fence values. There should be as many items as the number of boxes desired. This attribute has effect only under the q1/median/q3 signature. If
lowerfenceis not provided but a sample (inyorx) is set, we compute the lower as the last sample point below 1.5 times the IQR. - Sets the source reference on Chart Studio Cloud for
lowerfence. - Sets the marker angle in respect to
angleref. - Sets the marker color. It accepts either a specific color or an array of numbers that are mapped to the colorscale relative to the max and min values of the array or relative to
marker.cminandmarker.cmaxif set. - Sets the marker.line color. It accepts either a specific color or an array of numbers that are mapped to the colorscale relative to the max and min values of the array or relative to
marker.line.cminandmarker.line.cmaxif set. - Sets the border line color of the outlier sample points. Defaults to marker.color
- Sets the border line width (in px) of the outlier sample points.
- Sets the width (in px) of the lines bounding the marker points.
- Sets the marker opacity.
- Sets the color of the outlier sample points.
- Sets the marker size (in px).
- Sets the marker symbol type. Adding 100 is equivalent to appending -open to a symbol name. Adding 200 is equivalent to appending -dot to a symbol name. Adding 300 is equivalent to appending -open-dot or dot-open to a symbol name.
- Sets the mean values. There should be as many items as the number of boxes desired. This attribute has effect only under the q1/median/q3 signature. If
meanis not provided but a sample (inyorx) is set, we compute the mean for each box using the sample values. - Sets the source reference on Chart Studio Cloud for
mean. - Sets the median values. There should be as many items as the number of boxes desired.
- Sets the source reference on Chart Studio Cloud for
median. - Sets the source reference on Chart Studio Cloud for
meta. - Sets the trace name. The trace name appears as the legend item and on hover. For box traces, the name will also be used for the position coordinate, if
xandx0(yandy0if horizontal) are missing and the position axis is categorical - Determines whether or not notches are drawn. Notches displays a confidence interval around the median. We compute the confidence interval as median +/- 1.57 * IQR / sqrt(N), where IQR is the interquartile range and N is the sample size. If two boxes' notches do not overlap there is 95% confidence their medians differ. See https://sites.google.com/site/davidsstatistics/home/notched-box-plots for more info. Defaults to false unless
notchwidthornotchspanis set. - Sets the notch span from the boxes'
medianvalues. There should be as many items as the number of boxes desired. This attribute has effect only under the q1/median/q3 signature. Ifnotchspanis not provided but a sample (inyorx) is set, we compute it as 1.57 * IQR / sqrt(N), where N is the sample size. - Sets the source reference on Chart Studio Cloud for
notchspan. - Sets the width of the notches relative to the box' width. For example, with 0, the notches are as wide as the box(es).
- Set several traces linked to the same position axis or matching axes to the same offsetgroup where bars of the same position coordinate will line up.
- Sets the opacity of the trace.
- Sets the orientation of the box(es). If v (h), the distribution is visualized along the vertical (horizontal).
- Sets the position of the sample points in relation to the box(es). If 0, the sample points are places over the center of the box(es). Positive (negative) values correspond to positions to the right (left) for vertical boxes and above (below) for horizontal boxes
- Sets the Quartile 1 values. There should be as many items as the number of boxes desired.
- Sets the source reference on Chart Studio Cloud for
q1. - Sets the Quartile 3 values. There should be as many items as the number of boxes desired.
- Sets the source reference on Chart Studio Cloud for
q3. - Sets the method used to compute the sample's Q1 and Q3 quartiles. The linear method uses the 25th percentile for Q1 and 75th percentile for Q3 as computed using method #10 (listed on http://jse.amstat.org/v14n3/langford.html). The exclusive method uses the median to divide the ordered dataset into two halves if the sample is odd, it does not include the median in either half - Q1 is then the median of the lower half and Q3 the median of the upper half. The inclusive method also uses the median to divide the ordered dataset into two halves but if the sample is odd, it includes the median in both halves - Q1 is then the median of the lower half and Q3 the median of the upper half.
- Sets the standard deviation values. There should be as many items as the number of boxes desired. This attribute has effect only under the q1/median/q3 signature. If
sdis not provided but a sample (inyorx) is set, we compute the standard deviation for each box using the sample values. - Scales the box size when sizemode=sd Allowing boxes to be drawn across any stddev range For example 1-stddev, 3-stddev, 5-stddev
- Sets the source reference on Chart Studio Cloud for
sd. - Sets the marker color of selected points.
- Sets the marker opacity of selected points.
- Sets the marker size of selected points.
- Determines whether or not an item corresponding to this trace is shown in the legend.
- Determines whether or not whiskers are visible. Defaults to true for
sizemodequartiles, false for sd. - Sets the upper and lower bound for the boxes quartiles means box is drawn between Q1 and Q3 SD means the box is drawn between Mean +- Standard Deviation Argument sdmultiple (default 1) to scale the box size So it could be drawn 1-stddev, 3-stddev etc
- Sets the maximum number of points to keep on the plots from an incoming stream. If
maxpointsis set to 50, only the newest 50 points will be displayed on the plot. - The stream id number links a data trace on a plot with a stream. See https://chart-studio.plotly.com/settings for more details.
- Sets the text elements associated with each sample value. If a single string, the same string appears over all the data points. If an array of string, the items are mapped in order to the this trace's (x,y) coordinates. To be seen, trace
hoverinfomust contain a text flag. - Sets the source reference on Chart Studio Cloud for
text. - Assign an id to this trace, Use this to provide object constancy between traces during animations and transitions.
- Sets the marker color of unselected points, applied only when a selection exists.
- Sets the marker opacity of unselected points, applied only when a selection exists.
- Sets the marker size of unselected points, applied only when a selection exists.
- Sets the upper fence values. There should be as many items as the number of boxes desired. This attribute has effect only under the q1/median/q3 signature. If
upperfenceis not provided but a sample (inyorx) is set, we compute the upper as the last sample point above 1.5 times the IQR. - Sets the source reference on Chart Studio Cloud for
upperfence. - Determines whether or not this trace is visible. If legendonly, the trace is not drawn, but can appear as a legend item (provided that the legend itself is visible).
- Sets the width of the whiskers relative to the box' width. For example, with 1, the whiskers are as wide as the box(es).
- Sets the width of the box in data coordinate If 0 (default value) the width is automatically selected based on the positions of other box traces in the same subplot.
- Sets the x sample data or coordinates. See overview for more info.
- Sets a reference between this trace's x coordinates and a 2D cartesian x axis. If x (the default value), the x coordinates refer to
layout.xaxis. If x2, the x coordinates refer tolayout.xaxis2, and so on. - Sets the calendar system to use with
xdate data. - Sets the hover text formatting rulefor
xusing d3 formatting mini-languages which are very similar to those in Python. For numbers, see: https://github.com/d3/d3-format/tree/v1.4.5#d3-format. And for dates see: https://github.com/d3/d3-time-format/tree/v2.2.3#locale_format. We add two items to d3's date formatter: %h for half of the year as a decimal number as well as %{n}f for fractional seconds with n digits. For example, 2016-10-13 09:15:23.456 with tickformat %H~%M~%S.%2f would display 09~15~23.46By default the values are formatted usingxaxis.hoverformat. - Only relevant when the axis
typeis date. Sets the alignment of data points on the x axis. - Sets the source reference on Chart Studio Cloud for
x. - Sets the y sample data or coordinates. See overview for more info.
- Sets a reference between this trace's y coordinates and a 2D cartesian y axis. If y (the default value), the y coordinates refer to
layout.yaxis. If y2, the y coordinates refer tolayout.yaxis2, and so on. - Sets the calendar system to use with
ydate data. - Sets the hover text formatting rulefor
yusing d3 formatting mini-languages which are very similar to those in Python. For numbers, see: https://github.com/d3/d3-format/tree/v1.4.5#d3-format. And for dates see: https://github.com/d3/d3-time-format/tree/v2.2.3#locale_format. We add two items to d3's date formatter: %h for half of the year as a decimal number as well as %{n}f for fractional seconds with n digits. For example, 2016-10-13 09:15:23.456 with tickformat %H~%M~%S.%2f would display 09~15~23.46By default the values are formatted usingyaxis.hoverformat. - Only relevant when the axis
typeis date. Sets the alignment of data points on the y axis. - Sets the source reference on Chart Studio Cloud for
y. - Sets the layer on which this trace is displayed, relative to other SVG traces on the same subplot. SVG traces with higher
zorderappear in front of those with lowerzorder.