Candlestick
Overview
The candlestick trace type is commonly used in financial analysis to visualize the price movements of a stock or asset over time. It requires open, high, low, and close (OHLC) data and is useful for tracking the performance of a stock or identifying market trends.
You can control the appearance of candlestick charts through attributes such as increasing, decreasing, line, fillcolor, and more to highlight upward and downward trends in the market.
Common Uses
- Stock Market Analysis: Visualizing the performance of stocks over time.
- Trend Identification: Identifying market trends such as uptrends, downtrends, or reversals.
- Price Fluctuation Visualization: Showing how stock prices move within a specific time period (daily, weekly, etc.).
Check out the Attributes for the full set of configuration options
Examples
Common Configurations
Here's a simple candlestick plot showing stock price movements over a period:
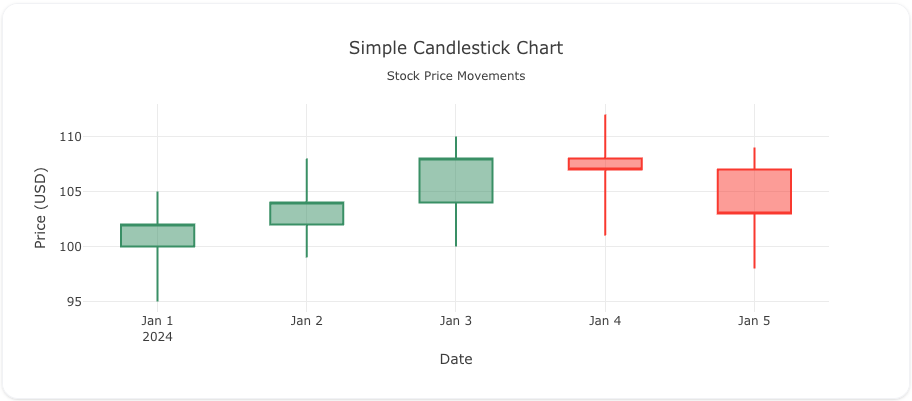
You can copy this code below to create this chart in your project:
models:
  - name: stock-data
    args:
      - echo
      - |
        date,open,high,low,close
        2024-01-01,100,105,95,102
        2024-01-02,102,108,99,104
        2024-01-03,104,110,100,108
        2024-01-04,108,112,101,107
        2024-01-05,107,109,98,103
traces:
  - name: Simple Candlestick Plot
    model: ${ref(stock-data)}
    props:
      type: candlestick
      x: ?{date}
      open: ?{open}
      high: ?{high}
      low: ?{low}
      close: ?{close}
charts:
  - name: Simple Candlestick Chart
    traces:
      - ${ref(Simple Candlestick Plot)}
    layout:
      title:
        text: Simple Candlestick Chart<br><sub>Stock Price Movements</sub>
      xaxis:
        rangeslider:
          visible: false
        title:
          text: "Date"
      yaxis:
        title:
          text: "Price (USD)"
This example includes both candlestick data and volume, providing additional insights into the market activity:
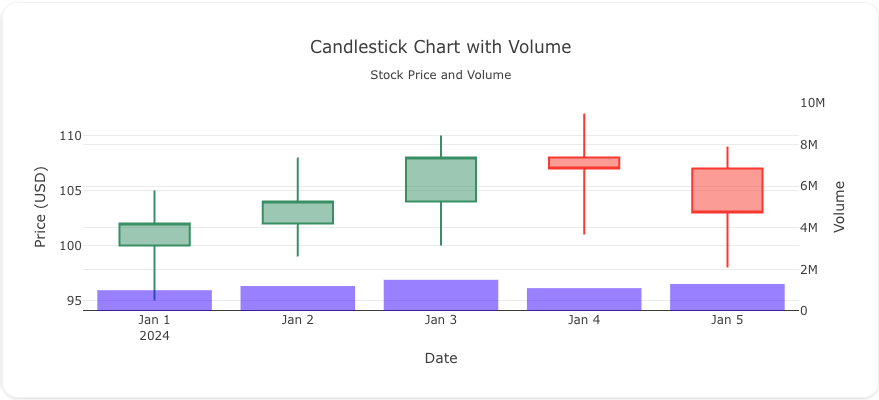
Here's the code:
models:
  - name: stock-data-with-volume
    args:
      - echo
      - |
        date,open,high,low,close,volume
        2024-01-01,100,105,95,102,1000000
        2024-01-02,102,108,99,104,1200000
        2024-01-03,104,110,100,108,1500000
        2024-01-04,108,112,101,107,1100000
        2024-01-05,107,109,98,103,1300000
traces:
  - name: Candlestick Plot with Volume
    model: ${ref(stock-data-with-volume)}
    props:
      type: candlestick
      x: ?{date}
      open: ?{open}
      high: ?{high}
      low: ?{low}
      close: ?{close}
  - name: Volume Trace
    model: ${ref(stock-data-with-volume)}
    props:
      type: bar
      x: ?{date}
      y: ?{volume}
      yaxis: "y2"
      marker:
        opacity: .5
        color: 'blue'
charts:
  - name: Candlestick Chart with Volume
    traces:
      - ${ref(Candlestick Plot with Volume)}
      - ${ref(Volume Trace)}
    layout:
      showlegend: false

      title:
        text: Candlestick Chart with Volume<br><sub>Stock Price and Volume</sub>
      xaxis:
        title:
          text: "Date"
        rangeslider:
          visible: false
      yaxis:
        title:
          text: "Price (USD)"

      yaxis2:
        title:
          text: "Volume"
        overlaying: "y"
        side: "right"
        range: [0, 10000000]
Here's a candlestick chart with customized colors for increasing and decreasing stock prices:
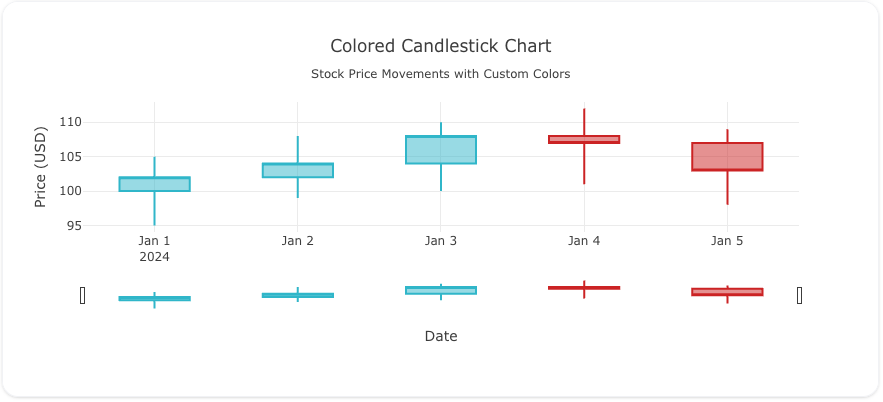
You can copy this code below to create this chart in your project:
models:
  - name: stock-data-colored
    args:
      - echo
      - |
        date,open,high,low,close
        2024-01-01,100,105,95,102
        2024-01-02,102,108,99,104
        2024-01-03,104,110,100,108
        2024-01-04,108,112,101,107
        2024-01-05,107,109,98,103
traces:
  - name: Colored Candlestick Plot
    model: ${ref(stock-data-colored)}
    props:
      type: candlestick
      x: ?{date}
      open: ?{open}
      high: ?{high}
      low: ?{low}
      close: ?{close}
      increasing:
        line:
          color: "#17becf"
      decreasing:
        line:
          color: "#d62728"
charts:
  - name: Candlestick with Custom Colors
    traces:
      - ${ref(Colored Candlestick Plot)}
    layout:
      title:
        text: Colored Candlestick Chart<br><sub>Stock Price Movements with Custom Colors</sub>
      xaxis:
        title:
          text: "Date"
      yaxis:
        title:
          text: "Price (USD)"
A schema to validate plotly trace properties
Attributes
These attributes apply to traces where trace.props.type is set to candlestick. You would configure these attributes on the trace with the trace.props object.
close: 'array' #(1)!
closesrc: 'string' #(2)!
customdata: 'array' #(3)!
customdatasrc: 'string' #(4)!
decreasing:
  fillcolor: 'any' #(5)!
  line:
    color: 'any' #(6)!
    width: 'number' #(7)!
high: 'array' #(8)!
highsrc: 'string' #(9)!
hoverinfo: 'array' #(10)!
hoverinfosrc: 'string' #(11)!
hoverlabel:
  align: 'array' #(12)!
  alignsrc: 'string' #(13)!
  bgcolor: 'color | array' #(14)!
  bgcolorsrc: 'string' #(15)!
  bordercolor: 'color | array' #(16)!
  bordercolorsrc: 'string' #(17)!
  font:
    color: color | array
    colorsrc: 'string' #(18)!
    family: 'string | array' #(19)!
    familysrc: 'string' #(20)!
    lineposition: 'array' #(21)!
    linepositionsrc: 'string' #(22)!
    shadow: 'string | array' #(23)!
    shadowsrc: 'string' #(24)!
    size: number | array
    sizesrc: 'string' #(25)!
    style: 'array' #(26)!
    stylesrc: 'string' #(27)!
    textcase: 'array' #(28)!
    textcasesrc: 'string' #(29)!
    variant: 'array' #(30)!
    variantsrc: 'string' #(31)!
    weight: 'integer | array' #(32)!
    weightsrc: 'string' #(33)!
  namelength: 'integer | array' #(34)!
  namelengthsrc: 'string' #(35)!
  split: 'boolean' #(36)!
hovertext: 'string | array' #(37)!
hovertextsrc: 'string' #(38)!
ids: 'array' #(39)!
idssrc: 'string' #(40)!
increasing:
  fillcolor: 'any' #(41)!
  line:
    color: 'any' #(42)!
    width: 'number' #(43)!
legend: 'string' #(44)!
legendgroup: 'string' #(45)!
legendgrouptitle:
  font:
    color: any
    family: 'string' #(46)!
    lineposition: 'string' #(47)!
    shadow: 'string' #(48)!
    size: number
    style: 'any' #(49)!
    textcase: 'any' #(50)!
    variant: 'any' #(51)!
    weight: 'integer' #(52)!
  text: 'string' #(53)!
legendrank: 'number' #(54)!
legendwidth: 'number' #(55)!
line:
  width: 'number' #(56)!
low: 'array' #(57)!
lowsrc: 'string' #(58)!
metasrc: 'string' #(59)!
name: 'string' #(60)!
opacity: 'number' #(61)!
open: 'array' #(62)!
opensrc: 'string' #(63)!
showlegend: 'boolean' #(64)!
stream:
  maxpoints: 'number' #(65)!
  token: 'string' #(66)!
text: 'string | array' #(67)!
textsrc: 'string' #(68)!
type: candlestick
uid: 'string' #(69)!
visible: 'any' #(70)!
whiskerwidth: 'number' #(71)!
x: 'array' #(72)!
xaxis: 'string' #(73)!
xcalendar: 'any' #(74)!
xhoverformat: 'string' #(75)!
xperiodalignment: 'any' #(76)!
xsrc: 'string' #(77)!
yaxis: 'string' #(78)!
yhoverformat: 'string' #(79)!
zorder: 'integer' #(80)!
- Sets the close values.
- Sets the source reference on Chart Studio Cloud for
close. - Assigns extra data each datum. This may be useful when listening to hover, click and selection events. Note that, scatter traces also appends customdata items in the markers DOM elements
- Sets the source reference on Chart Studio Cloud for
customdata. - Sets the fill color. Defaults to a half-transparent variant of the line color, marker color, or marker line color, whichever is available.
- Sets the color of line bounding the box(es).
- Sets the width (in px) of line bounding the box(es).
- Sets the high values.
- Sets the source reference on Chart Studio Cloud for
high. - Determines which trace information appear on hover. If
noneorskipare set, no information is displayed upon hovering. But, ifnoneis set, click and hover events are still fired. - Sets the source reference on Chart Studio Cloud for
hoverinfo. - Sets the horizontal alignment of the text content within hover label box. Has an effect only if the hover label text spans more two or more lines
- Sets the source reference on Chart Studio Cloud for
align. - Sets the background color of the hover labels for this trace
- Sets the source reference on Chart Studio Cloud for
bgcolor. - Sets the border color of the hover labels for this trace.
- Sets the source reference on Chart Studio Cloud for
bordercolor. - Sets the source reference on Chart Studio Cloud for
color. - HTML font family - the typeface that will be applied by the web browser. The web browser can only apply a font if it is available on the system where it runs. Provide multiple font families, separated by commas, to indicate the order in which to apply fonts if they aren't available.
- Sets the source reference on Chart Studio Cloud for
family. - Sets the kind of decoration line(s) with text, such as an under, over or through as well as combinations e.g. under+over, etc.
- Sets the source reference on Chart Studio Cloud for
lineposition. - Sets the shape and color of the shadow behind text. auto places minimal shadow and applies contrast text font color. See https://developer.mozilla.org/en-US/docs/Web/CSS/text-shadow for additional options.
- Sets the source reference on Chart Studio Cloud for
shadow. - Sets the source reference on Chart Studio Cloud for
size. - Sets whether a font should be styled with a normal or italic face from its family.
- Sets the source reference on Chart Studio Cloud for
style. - Sets capitalization of text. It can be used to make text appear in all-uppercase or all-lowercase, or with each word capitalized.
- Sets the source reference on Chart Studio Cloud for
textcase. - Sets the variant of the font.
- Sets the source reference on Chart Studio Cloud for
variant. - Sets the weight (or boldness) of the font.
- Sets the source reference on Chart Studio Cloud for
weight. - Sets the default length (in number of characters) of the trace name in the hover labels for all traces. -1 shows the whole name regardless of length. 0-3 shows the first 0-3 characters, and an integer >3 will show the whole name if it is less than that many characters, but if it is longer, will truncate to
namelength - 3characters and add an ellipsis. - Sets the source reference on Chart Studio Cloud for
namelength. - Show hover information (open, close, high, low) in separate labels.
- Same as
text. - Sets the source reference on Chart Studio Cloud for
hovertext. - Assigns id labels to each datum. These ids for object constancy of data points during animation. Should be an array of strings, not numbers or any other type.
- Sets the source reference on Chart Studio Cloud for
ids. - Sets the fill color. Defaults to a half-transparent variant of the line color, marker color, or marker line color, whichever is available.
- Sets the color of line bounding the box(es).
- Sets the width (in px) of line bounding the box(es).
- Sets the reference to a legend to show this trace in. References to these legends are legend, legend2, legend3, etc. Settings for these legends are set in the layout, under
layout.legend,layout.legend2, etc. - Sets the legend group for this trace. Traces and shapes part of the same legend group hide/show at the same time when toggling legend items.
- HTML font family - the typeface that will be applied by the web browser. The web browser can only apply a font if it is available on the system where it runs. Provide multiple font families, separated by commas, to indicate the order in which to apply fonts if they aren't available.
- Sets the kind of decoration line(s) with text, such as an under, over or through as well as combinations e.g. under+over, etc.
- Sets the shape and color of the shadow behind text. auto places minimal shadow and applies contrast text font color. See https://developer.mozilla.org/en-US/docs/Web/CSS/text-shadow for additional options.
- Sets whether a font should be styled with a normal or italic face from its family.
- Sets capitalization of text. It can be used to make text appear in all-uppercase or all-lowercase, or with each word capitalized.
- Sets the variant of the font.
- Sets the weight (or boldness) of the font.
- Sets the title of the legend group.
- Sets the legend rank for this trace. Items and groups with smaller ranks are presented on top/left side while with reversed
legend.traceorderthey are on bottom/right side. The default legendrank is 1000, so that you can use ranks less than 1000 to place certain items before all unranked items, and ranks greater than 1000 to go after all unranked items. When having unranked or equal rank items shapes would be displayed after traces i.e. according to their order in data and layout. - Sets the width (in px or fraction) of the legend for this trace.
- Sets the width (in px) of line bounding the box(es). Note that this style setting can also be set per direction via
increasing.line.widthanddecreasing.line.width. - Sets the low values.
- Sets the source reference on Chart Studio Cloud for
low. - Sets the source reference on Chart Studio Cloud for
meta. - Sets the trace name. The trace name appears as the legend item and on hover.
- Sets the opacity of the trace.
- Sets the open values.
- Sets the source reference on Chart Studio Cloud for
open. - Determines whether or not an item corresponding to this trace is shown in the legend.
- Sets the maximum number of points to keep on the plots from an incoming stream. If
maxpointsis set to 50, only the newest 50 points will be displayed on the plot. - The stream id number links a data trace on a plot with a stream. See https://chart-studio.plotly.com/settings for more details.
- Sets hover text elements associated with each sample point. If a single string, the same string appears over all the data points. If an array of string, the items are mapped in order to this trace's sample points.
- Sets the source reference on Chart Studio Cloud for
text. - Assign an id to this trace, Use this to provide object constancy between traces during animations and transitions.
- Determines whether or not this trace is visible. If legendonly, the trace is not drawn, but can appear as a legend item (provided that the legend itself is visible).
- Sets the width of the whiskers relative to the box' width. For example, with 1, the whiskers are as wide as the box(es).
- Sets the x coordinates. If absent, linear coordinate will be generated.
- Sets a reference between this trace's x coordinates and a 2D cartesian x axis. If x (the default value), the x coordinates refer to
layout.xaxis. If x2, the x coordinates refer tolayout.xaxis2, and so on. - Sets the calendar system to use with
xdate data. - Sets the hover text formatting rulefor
xusing d3 formatting mini-languages which are very similar to those in Python. For numbers, see: https://github.com/d3/d3-format/tree/v1.4.5#d3-format. And for dates see: https://github.com/d3/d3-time-format/tree/v2.2.3#locale_format. We add two items to d3's date formatter: %h for half of the year as a decimal number as well as %{n}f for fractional seconds with n digits. For example, 2016-10-13 09:15:23.456 with tickformat %H~%M~%S.%2f would display 09~15~23.46By default the values are formatted usingxaxis.hoverformat. - Only relevant when the axis
typeis date. Sets the alignment of data points on the x axis. - Sets the source reference on Chart Studio Cloud for
x. - Sets a reference between this trace's y coordinates and a 2D cartesian y axis. If y (the default value), the y coordinates refer to
layout.yaxis. If y2, the y coordinates refer tolayout.yaxis2, and so on. - Sets the hover text formatting rulefor
yusing d3 formatting mini-languages which are very similar to those in Python. For numbers, see: https://github.com/d3/d3-format/tree/v1.4.5#d3-format. And for dates see: https://github.com/d3/d3-time-format/tree/v2.2.3#locale_format. We add two items to d3's date formatter: %h for half of the year as a decimal number as well as %{n}f for fractional seconds with n digits. For example, 2016-10-13 09:15:23.456 with tickformat %H~%M~%S.%2f would display 09~15~23.46By default the values are formatted usingyaxis.hoverformat. - Sets the layer on which this trace is displayed, relative to other SVG traces on the same subplot. SVG traces with higher
zorderappear in front of those with lowerzorder.