Carpet
Overview
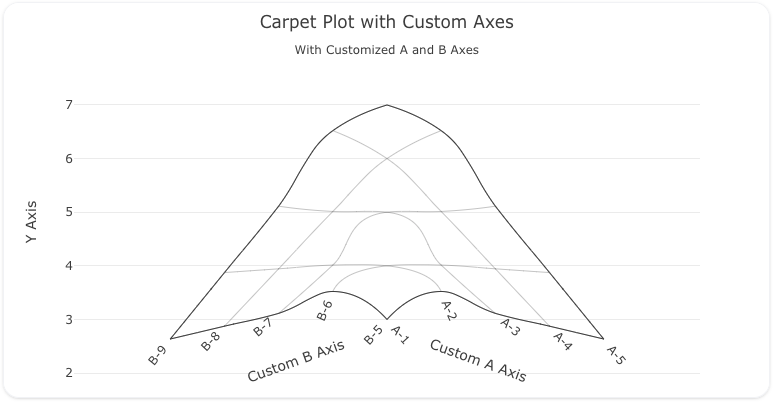
The carpet trace type is used to create carpet plots, which can be useful for visualizing data across irregular spaces or non-grid-like arrangements. Carpet plots are commonly employed in complex datasets that span two independent variables, such as pressure and temperature or other bivariate datasets.
Carpet traces provide you with control over the X and Y axes, as well as customization of the A and B axes (the independent variables). You can also use a variety of formatting options, including line, color, and axis ticks to enhance the visualization.
Common Uses
- Distortion Analysis: Visualizing data across irregular spaces, such as in physics or engineering.
- Bivariate Data Visualization: Displaying complex relationships between two independent variables.
- Gridless Data Representation: Visualizing data that doesn't fit neatly into grid-like structures.
Check out the Attributes for the full set of configuration options
Examples
Common Configurations
Here's a simple(ish) carpet plot showing data across two independent variables (A and B):
You can copy this code below to create this chart in your project:
models:
  - name: carpet-data-axes
    args:
      - echo
      - |
        a,b,x,y
        1,5,2,3
        2,6,3,4
        3,7,4,5
        4,8,5,6
        5,9,6,7
traces:
  - name: Carpet Plot with Custom Axes
    model: ${ref(carpet-data-axes)}
    props:
      type: carpet
      a: ?{a}
      b: ?{b}
      y: ?{y}
      aaxis:
        title:
          text: "Custom A Axis"
        tickprefix: "A-"
      baxis:
        title:
          text: "Custom B Axis"
        tickprefix: "B-"
charts:
  - name: Simple Carpet Chart
    traces:
      - ${ref(Carpet Plot with Custom Axes)}
    layout:
      title:
        text: Carpet Plot with Custom Axes<br><sub>With Customized A and B Axes</sub>
      xaxis:
        title:
          text: "X Axis"
      yaxis:
        title:
          text: "Y Axis"
      margin:
        b: 0
        r: 70
        l: 70
        t: 50
A schema to validate plotly trace properties
Attributes
These attributes apply to traces where trace.props.type is set to carpet. You would configure these attributes on the trace with the trace.props object.
a: 'array' #(1)!
a0: 'number' #(2)!
aaxis:
  arraydtick: 'integer' #(3)!
  arraytick0: 'integer' #(4)!
  autorange: 'any' #(5)!
  autotypenumbers: 'any' #(6)!
  categoryarray: 'array' #(7)!
  categoryarraysrc: 'string' #(8)!
  categoryorder: 'any' #(9)!
  cheatertype: any
  color: 'any' #(10)!
  dtick: 'number' #(11)!
  endline: 'boolean' #(12)!
  endlinecolor: 'any' #(13)!
  endlinewidth: 'number' #(14)!
  exponentformat: 'any' #(15)!
  fixedrange: 'boolean' #(16)!
  gridcolor: 'any' #(17)!
  griddash: 'string' #(18)!
  gridwidth: 'number' #(19)!
  labelpadding: 'integer' #(20)!
  labelprefix: 'string' #(21)!
  labelsuffix: 'string' #(22)!
  linecolor: 'any' #(23)!
  linewidth: 'number' #(24)!
  minexponent: 'number' #(25)!
  minorgridcolor: 'any' #(26)!
  minorgridcount: 'integer' #(27)!
  minorgriddash: 'string' #(28)!
  minorgridwidth: 'number' #(29)!
  nticks: 'integer' #(30)!
  range: 'array' #(31)!
  rangemode: 'any' #(32)!
  separatethousands: 'boolean' #(33)!
  showexponent: 'any' #(34)!
  showgrid: 'boolean' #(35)!
  showline: 'boolean' #(36)!
  showticklabels: 'any' #(37)!
  showtickprefix: 'any' #(38)!
  showticksuffix: 'any' #(39)!
  smoothing: number
  startline: 'boolean' #(40)!
  startlinecolor: 'any' #(41)!
  startlinewidth: 'number' #(42)!
  tick0: 'number' #(43)!
  tickangle: 'number' #(44)!
  tickfont:
    color: any
    family: 'string' #(45)!
    lineposition: 'string' #(46)!
    shadow: 'string' #(47)!
    size: number
    style: 'any' #(48)!
    textcase: 'any' #(49)!
    variant: 'any' #(50)!
    weight: 'integer' #(51)!
  tickformat: 'string' #(52)!
  tickformatstops: array
  tickmode: any
  tickprefix: 'string' #(53)!
  ticksuffix: 'string' #(54)!
  ticktext: 'array' #(55)!
  ticktextsrc: 'string' #(56)!
  tickvals: 'array' #(57)!
  tickvalssrc: 'string' #(58)!
  title:
    font:
      color: any
      family: 'string' #(59)!
      lineposition: 'string' #(60)!
      shadow: 'string' #(61)!
      size: number
      style: 'any' #(62)!
      textcase: 'any' #(63)!
      variant: 'any' #(64)!
      weight: 'integer' #(65)!
    offset: 'number' #(66)!
    text: 'string' #(67)!
  type: 'any' #(68)!
asrc: 'string' #(69)!
b: 'array' #(70)!
b0: 'number' #(71)!
baxis:
  arraydtick: 'integer' #(72)!
  arraytick0: 'integer' #(73)!
  autorange: 'any' #(74)!
  autotypenumbers: 'any' #(75)!
  categoryarray: 'array' #(76)!
  categoryarraysrc: 'string' #(77)!
  categoryorder: 'any' #(78)!
  cheatertype: any
  color: 'any' #(79)!
  dtick: 'number' #(80)!
  endline: 'boolean' #(81)!
  endlinecolor: 'any' #(82)!
  endlinewidth: 'number' #(83)!
  exponentformat: 'any' #(84)!
  fixedrange: 'boolean' #(85)!
  gridcolor: 'any' #(86)!
  griddash: 'string' #(87)!
  gridwidth: 'number' #(88)!
  labelpadding: 'integer' #(89)!
  labelprefix: 'string' #(90)!
  labelsuffix: 'string' #(91)!
  linecolor: 'any' #(92)!
  linewidth: 'number' #(93)!
  minexponent: 'number' #(94)!
  minorgridcolor: 'any' #(95)!
  minorgridcount: 'integer' #(96)!
  minorgriddash: 'string' #(97)!
  minorgridwidth: 'number' #(98)!
  nticks: 'integer' #(99)!
  range: 'array' #(100)!
  rangemode: 'any' #(101)!
  separatethousands: 'boolean' #(102)!
  showexponent: 'any' #(103)!
  showgrid: 'boolean' #(104)!
  showline: 'boolean' #(105)!
  showticklabels: 'any' #(106)!
  showtickprefix: 'any' #(107)!
  showticksuffix: 'any' #(108)!
  smoothing: number
  startline: 'boolean' #(109)!
  startlinecolor: 'any' #(110)!
  startlinewidth: 'number' #(111)!
  tick0: 'number' #(112)!
  tickangle: 'number' #(113)!
  tickfont:
    color: any
    family: 'string' #(114)!
    lineposition: 'string' #(115)!
    shadow: 'string' #(116)!
    size: number
    style: 'any' #(117)!
    textcase: 'any' #(118)!
    variant: 'any' #(119)!
    weight: 'integer' #(120)!
  tickformat: 'string' #(121)!
  tickformatstops: array
  tickmode: any
  tickprefix: 'string' #(122)!
  ticksuffix: 'string' #(123)!
  ticktext: 'array' #(124)!
  ticktextsrc: 'string' #(125)!
  tickvals: 'array' #(126)!
  tickvalssrc: 'string' #(127)!
  title:
    font:
      color: any
      family: 'string' #(128)!
      lineposition: 'string' #(129)!
      shadow: 'string' #(130)!
      size: number
      style: 'any' #(131)!
      textcase: 'any' #(132)!
      variant: 'any' #(133)!
      weight: 'integer' #(134)!
    offset: 'number' #(135)!
    text: 'string' #(136)!
  type: 'any' #(137)!
bsrc: 'string' #(138)!
carpet: 'string' #(139)!
cheaterslope: 'number' #(140)!
color: 'any' #(141)!
customdata: 'array' #(142)!
customdatasrc: 'string' #(143)!
da: 'number' #(144)!
db: 'number' #(145)!
font:
  color: any
  family: 'string' #(146)!
  lineposition: 'string' #(147)!
  shadow: 'string' #(148)!
  size: number
  style: 'any' #(149)!
  textcase: 'any' #(150)!
  variant: 'any' #(151)!
  weight: 'integer' #(152)!
ids: 'array' #(153)!
idssrc: 'string' #(154)!
legend: 'string' #(155)!
legendgrouptitle:
  font:
    color: any
    family: 'string' #(156)!
    lineposition: 'string' #(157)!
    shadow: 'string' #(158)!
    size: number
    style: 'any' #(159)!
    textcase: 'any' #(160)!
    variant: 'any' #(161)!
    weight: 'integer' #(162)!
  text: 'string' #(163)!
legendrank: 'number' #(164)!
legendwidth: 'number' #(165)!
metasrc: 'string' #(166)!
name: 'string' #(167)!
opacity: 'number' #(168)!
stream:
  maxpoints: 'number' #(169)!
  token: 'string' #(170)!
type: carpet
uid: 'string' #(171)!
visible: 'any' #(172)!
x: 'array' #(173)!
xaxis: 'string' #(174)!
xsrc: 'string' #(175)!
y: 'array' #(176)!
yaxis: 'string' #(177)!
ysrc: 'string' #(178)!
zorder: 'integer' #(179)!
- An array containing values of the first parameter value
- Alternate to
a. Builds a linear space of a coordinates. Use withdawherea0is the starting coordinate anddathe step. - The stride between grid lines along the axis
- The starting index of grid lines along the axis
- Determines whether or not the range of this axis is computed in relation to the input data. See
rangemodefor more info. Ifrangeis provided, thenautorangeis set to false. - Using strict a numeric string in trace data is not converted to a number. Using convert types a numeric string in trace data may be treated as a number during automatic axis
typedetection. Defaults to layout.autotypenumbers. - Sets the order in which categories on this axis appear. Only has an effect if
categoryorderis set to array. Used withcategoryorder. - Sets the source reference on Chart Studio Cloud for
categoryarray. - Specifies the ordering logic for the case of categorical variables. By default, plotly uses trace, which specifies the order that is present in the data supplied. Set
categoryorderto category ascending or category descending if order should be determined by the alphanumerical order of the category names. Setcategoryorderto array to derive the ordering from the attributecategoryarray. If a category is not found in thecategoryarrayarray, the sorting behavior for that attribute will be identical to the trace mode. The unspecified categories will follow the categories incategoryarray. - Sets default for all colors associated with this axis all at once: line, font, tick, and grid colors. Grid color is lightened by blending this with the plot background Individual pieces can override this.
- The stride between grid lines along the axis
- Determines whether or not a line is drawn at along the final value of this axis. If true, the end line is drawn on top of the grid lines.
- Sets the line color of the end line.
- Sets the width (in px) of the end line.
- Determines a formatting rule for the tick exponents. For example, consider the number 1,000,000,000. If none, it appears as 1,000,000,000. If e, 1e+9. If E, 1E+9. If power, 1x10^9 (with 9 in a super script). If SI, 1G. If B, 1B.
- Determines whether or not this axis is zoom-able. If true, then zoom is disabled.
- Sets the axis line color.
- Sets the dash style of lines. Set to a dash type string (solid, dot, dash, longdash, dashdot, or longdashdot) or a dash length list in px (eg 5px,10px,2px,2px).
- Sets the width (in px) of the axis line.
- Extra padding between label and the axis
- Sets a axis label prefix.
- Sets a axis label suffix.
- Sets the axis line color.
- Sets the width (in px) of the axis line.
- Hide SI prefix for 10^n if |n| is below this number
- Sets the color of the grid lines.
- Sets the number of minor grid ticks per major grid tick
- Sets the dash style of lines. Set to a dash type string (solid, dot, dash, longdash, dashdot, or longdashdot) or a dash length list in px (eg 5px,10px,2px,2px).
- Sets the width (in px) of the grid lines.
- Specifies the maximum number of ticks for the particular axis. The actual number of ticks will be chosen automatically to be less than or equal to
nticks. Has an effect only iftickmodeis set to auto. - Sets the range of this axis. If the axis
typeis log, then you must take the log of your desired range (e.g. to set the range from 1 to 100, set the range from 0 to 2). If the axistypeis date, it should be date strings, like date data, though Date objects and unix milliseconds will be accepted and converted to strings. If the axistypeis category, it should be numbers, using the scale where each category is assigned a serial number from zero in the order it appears. - If normal, the range is computed in relation to the extrema of the input data. If tozero`, the range extends to 0, regardless of the input data If nonnegative, the range is non-negative, regardless of the input data.
- If "true", even 4-digit integers are separated
- If all, all exponents are shown besides their significands. If first, only the exponent of the first tick is shown. If last, only the exponent of the last tick is shown. If none, no exponents appear.
- Determines whether or not grid lines are drawn. If true, the grid lines are drawn at every tick mark.
- Determines whether or not a line bounding this axis is drawn.
- Determines whether axis labels are drawn on the low side, the high side, both, or neither side of the axis.
- If all, all tick labels are displayed with a prefix. If first, only the first tick is displayed with a prefix. If last, only the last tick is displayed with a suffix. If none, tick prefixes are hidden.
- Same as
showtickprefixbut for tick suffixes. - Determines whether or not a line is drawn at along the starting value of this axis. If true, the start line is drawn on top of the grid lines.
- Sets the line color of the start line.
- Sets the width (in px) of the start line.
- The starting index of grid lines along the axis
- Sets the angle of the tick labels with respect to the horizontal. For example, a
tickangleof -90 draws the tick labels vertically. - HTML font family - the typeface that will be applied by the web browser. The web browser can only apply a font if it is available on the system where it runs. Provide multiple font families, separated by commas, to indicate the order in which to apply fonts if they aren't available.
- Sets the kind of decoration line(s) with text, such as an under, over or through as well as combinations e.g. under+over, etc.
- Sets the shape and color of the shadow behind text. auto places minimal shadow and applies contrast text font color. See https://developer.mozilla.org/en-US/docs/Web/CSS/text-shadow for additional options.
- Sets whether a font should be styled with a normal or italic face from its family.
- Sets capitalization of text. It can be used to make text appear in all-uppercase or all-lowercase, or with each word capitalized.
- Sets the variant of the font.
- Sets the weight (or boldness) of the font.
- Sets the tick label formatting rule using d3 formatting mini-languages which are very similar to those in Python. For numbers, see: https://github.com/d3/d3-format/tree/v1.4.5#d3-format. And for dates see: https://github.com/d3/d3-time-format/tree/v2.2.3#locale_format. We add two items to d3's date formatter: %h for half of the year as a decimal number as well as %{n}f for fractional seconds with n digits. For example, 2016-10-13 09:15:23.456 with tickformat %H~%M~%S.%2f would display 09~15~23.46
- Sets a tick label prefix.
- Sets a tick label suffix.
- Sets the text displayed at the ticks position via
tickvals. Only has an effect iftickmodeis set to array. Used withtickvals. - Sets the source reference on Chart Studio Cloud for
ticktext. - Sets the values at which ticks on this axis appear. Only has an effect if
tickmodeis set to array. Used withticktext. - Sets the source reference on Chart Studio Cloud for
tickvals. - HTML font family - the typeface that will be applied by the web browser. The web browser can only apply a font if it is available on the system where it runs. Provide multiple font families, separated by commas, to indicate the order in which to apply fonts if they aren't available.
- Sets the kind of decoration line(s) with text, such as an under, over or through as well as combinations e.g. under+over, etc.
- Sets the shape and color of the shadow behind text. auto places minimal shadow and applies contrast text font color. See https://developer.mozilla.org/en-US/docs/Web/CSS/text-shadow for additional options.
- Sets whether a font should be styled with a normal or italic face from its family.
- Sets capitalization of text. It can be used to make text appear in all-uppercase or all-lowercase, or with each word capitalized.
- Sets the variant of the font.
- Sets the weight (or boldness) of the font.
- An additional amount by which to offset the title from the tick labels, given in pixels.
- Sets the title of this axis.
- Sets the axis type. By default, plotly attempts to determined the axis type by looking into the data of the traces that referenced the axis in question.
- Sets the source reference on Chart Studio Cloud for
a. - A two dimensional array of y coordinates at each carpet point.
- Alternate to
b. Builds a linear space of a coordinates. Use withdbwhereb0is the starting coordinate anddbthe step. - The stride between grid lines along the axis
- The starting index of grid lines along the axis
- Determines whether or not the range of this axis is computed in relation to the input data. See
rangemodefor more info. Ifrangeis provided, thenautorangeis set to false. - Using strict a numeric string in trace data is not converted to a number. Using convert types a numeric string in trace data may be treated as a number during automatic axis
typedetection. Defaults to layout.autotypenumbers. - Sets the order in which categories on this axis appear. Only has an effect if
categoryorderis set to array. Used withcategoryorder. - Sets the source reference on Chart Studio Cloud for
categoryarray. - Specifies the ordering logic for the case of categorical variables. By default, plotly uses trace, which specifies the order that is present in the data supplied. Set
categoryorderto category ascending or category descending if order should be determined by the alphanumerical order of the category names. Setcategoryorderto array to derive the ordering from the attributecategoryarray. If a category is not found in thecategoryarrayarray, the sorting behavior for that attribute will be identical to the trace mode. The unspecified categories will follow the categories incategoryarray. - Sets default for all colors associated with this axis all at once: line, font, tick, and grid colors. Grid color is lightened by blending this with the plot background Individual pieces can override this.
- The stride between grid lines along the axis
- Determines whether or not a line is drawn at along the final value of this axis. If true, the end line is drawn on top of the grid lines.
- Sets the line color of the end line.
- Sets the width (in px) of the end line.
- Determines a formatting rule for the tick exponents. For example, consider the number 1,000,000,000. If none, it appears as 1,000,000,000. If e, 1e+9. If E, 1E+9. If power, 1x10^9 (with 9 in a super script). If SI, 1G. If B, 1B.
- Determines whether or not this axis is zoom-able. If true, then zoom is disabled.
- Sets the axis line color.
- Sets the dash style of lines. Set to a dash type string (solid, dot, dash, longdash, dashdot, or longdashdot) or a dash length list in px (eg 5px,10px,2px,2px).
- Sets the width (in px) of the axis line.
- Extra padding between label and the axis
- Sets a axis label prefix.
- Sets a axis label suffix.
- Sets the axis line color.
- Sets the width (in px) of the axis line.
- Hide SI prefix for 10^n if |n| is below this number
- Sets the color of the grid lines.
- Sets the number of minor grid ticks per major grid tick
- Sets the dash style of lines. Set to a dash type string (solid, dot, dash, longdash, dashdot, or longdashdot) or a dash length list in px (eg 5px,10px,2px,2px).
- Sets the width (in px) of the grid lines.
- Specifies the maximum number of ticks for the particular axis. The actual number of ticks will be chosen automatically to be less than or equal to
nticks. Has an effect only iftickmodeis set to auto. - Sets the range of this axis. If the axis
typeis log, then you must take the log of your desired range (e.g. to set the range from 1 to 100, set the range from 0 to 2). If the axistypeis date, it should be date strings, like date data, though Date objects and unix milliseconds will be accepted and converted to strings. If the axistypeis category, it should be numbers, using the scale where each category is assigned a serial number from zero in the order it appears. - If normal, the range is computed in relation to the extrema of the input data. If tozero`, the range extends to 0, regardless of the input data If nonnegative, the range is non-negative, regardless of the input data.
- If "true", even 4-digit integers are separated
- If all, all exponents are shown besides their significands. If first, only the exponent of the first tick is shown. If last, only the exponent of the last tick is shown. If none, no exponents appear.
- Determines whether or not grid lines are drawn. If true, the grid lines are drawn at every tick mark.
- Determines whether or not a line bounding this axis is drawn.
- Determines whether axis labels are drawn on the low side, the high side, both, or neither side of the axis.
- If all, all tick labels are displayed with a prefix. If first, only the first tick is displayed with a prefix. If last, only the last tick is displayed with a suffix. If none, tick prefixes are hidden.
- Same as
showtickprefixbut for tick suffixes. - Determines whether or not a line is drawn at along the starting value of this axis. If true, the start line is drawn on top of the grid lines.
- Sets the line color of the start line.
- Sets the width (in px) of the start line.
- The starting index of grid lines along the axis
- Sets the angle of the tick labels with respect to the horizontal. For example, a
tickangleof -90 draws the tick labels vertically. - HTML font family - the typeface that will be applied by the web browser. The web browser can only apply a font if it is available on the system where it runs. Provide multiple font families, separated by commas, to indicate the order in which to apply fonts if they aren't available.
- Sets the kind of decoration line(s) with text, such as an under, over or through as well as combinations e.g. under+over, etc.
- Sets the shape and color of the shadow behind text. auto places minimal shadow and applies contrast text font color. See https://developer.mozilla.org/en-US/docs/Web/CSS/text-shadow for additional options.
- Sets whether a font should be styled with a normal or italic face from its family.
- Sets capitalization of text. It can be used to make text appear in all-uppercase or all-lowercase, or with each word capitalized.
- Sets the variant of the font.
- Sets the weight (or boldness) of the font.
- Sets the tick label formatting rule using d3 formatting mini-languages which are very similar to those in Python. For numbers, see: https://github.com/d3/d3-format/tree/v1.4.5#d3-format. And for dates see: https://github.com/d3/d3-time-format/tree/v2.2.3#locale_format. We add two items to d3's date formatter: %h for half of the year as a decimal number as well as %{n}f for fractional seconds with n digits. For example, 2016-10-13 09:15:23.456 with tickformat %H~%M~%S.%2f would display 09~15~23.46
- Sets a tick label prefix.
- Sets a tick label suffix.
- Sets the text displayed at the ticks position via
tickvals. Only has an effect iftickmodeis set to array. Used withtickvals. - Sets the source reference on Chart Studio Cloud for
ticktext. - Sets the values at which ticks on this axis appear. Only has an effect if
tickmodeis set to array. Used withticktext. - Sets the source reference on Chart Studio Cloud for
tickvals. - HTML font family - the typeface that will be applied by the web browser. The web browser can only apply a font if it is available on the system where it runs. Provide multiple font families, separated by commas, to indicate the order in which to apply fonts if they aren't available.
- Sets the kind of decoration line(s) with text, such as an under, over or through as well as combinations e.g. under+over, etc.
- Sets the shape and color of the shadow behind text. auto places minimal shadow and applies contrast text font color. See https://developer.mozilla.org/en-US/docs/Web/CSS/text-shadow for additional options.
- Sets whether a font should be styled with a normal or italic face from its family.
- Sets capitalization of text. It can be used to make text appear in all-uppercase or all-lowercase, or with each word capitalized.
- Sets the variant of the font.
- Sets the weight (or boldness) of the font.
- An additional amount by which to offset the title from the tick labels, given in pixels.
- Sets the title of this axis.
- Sets the axis type. By default, plotly attempts to determined the axis type by looking into the data of the traces that referenced the axis in question.
- Sets the source reference on Chart Studio Cloud for
b. - An identifier for this carpet, so that
scattercarpetandcontourcarpettraces can specify a carpet plot on which they lie - The shift applied to each successive row of data in creating a cheater plot. Only used if
xis been omitted. - Sets default for all colors associated with this axis all at once: line, font, tick, and grid colors. Grid color is lightened by blending this with the plot background Individual pieces can override this.
- Assigns extra data each datum. This may be useful when listening to hover, click and selection events. Note that, scatter traces also appends customdata items in the markers DOM elements
- Sets the source reference on Chart Studio Cloud for
customdata. - Sets the a coordinate step. See
a0for more info. - Sets the b coordinate step. See
b0for more info. - HTML font family - the typeface that will be applied by the web browser. The web browser can only apply a font if it is available on the system where it runs. Provide multiple font families, separated by commas, to indicate the order in which to apply fonts if they aren't available.
- Sets the kind of decoration line(s) with text, such as an under, over or through as well as combinations e.g. under+over, etc.
- Sets the shape and color of the shadow behind text. auto places minimal shadow and applies contrast text font color. See https://developer.mozilla.org/en-US/docs/Web/CSS/text-shadow for additional options.
- Sets whether a font should be styled with a normal or italic face from its family.
- Sets capitalization of text. It can be used to make text appear in all-uppercase or all-lowercase, or with each word capitalized.
- Sets the variant of the font.
- Sets the weight (or boldness) of the font.
- Assigns id labels to each datum. These ids for object constancy of data points during animation. Should be an array of strings, not numbers or any other type.
- Sets the source reference on Chart Studio Cloud for
ids. - Sets the reference to a legend to show this trace in. References to these legends are legend, legend2, legend3, etc. Settings for these legends are set in the layout, under
layout.legend,layout.legend2, etc. - HTML font family - the typeface that will be applied by the web browser. The web browser can only apply a font if it is available on the system where it runs. Provide multiple font families, separated by commas, to indicate the order in which to apply fonts if they aren't available.
- Sets the kind of decoration line(s) with text, such as an under, over or through as well as combinations e.g. under+over, etc.
- Sets the shape and color of the shadow behind text. auto places minimal shadow and applies contrast text font color. See https://developer.mozilla.org/en-US/docs/Web/CSS/text-shadow for additional options.
- Sets whether a font should be styled with a normal or italic face from its family.
- Sets capitalization of text. It can be used to make text appear in all-uppercase or all-lowercase, or with each word capitalized.
- Sets the variant of the font.
- Sets the weight (or boldness) of the font.
- Sets the title of the legend group.
- Sets the legend rank for this trace. Items and groups with smaller ranks are presented on top/left side while with reversed
legend.traceorderthey are on bottom/right side. The default legendrank is 1000, so that you can use ranks less than 1000 to place certain items before all unranked items, and ranks greater than 1000 to go after all unranked items. When having unranked or equal rank items shapes would be displayed after traces i.e. according to their order in data and layout. - Sets the width (in px or fraction) of the legend for this trace.
- Sets the source reference on Chart Studio Cloud for
meta. - Sets the trace name. The trace name appears as the legend item and on hover.
- Sets the opacity of the trace.
- Sets the maximum number of points to keep on the plots from an incoming stream. If
maxpointsis set to 50, only the newest 50 points will be displayed on the plot. - The stream id number links a data trace on a plot with a stream. See https://chart-studio.plotly.com/settings for more details.
- Assign an id to this trace, Use this to provide object constancy between traces during animations and transitions.
- Determines whether or not this trace is visible. If legendonly, the trace is not drawn, but can appear as a legend item (provided that the legend itself is visible).
- A two dimensional array of x coordinates at each carpet point. If omitted, the plot is a cheater plot and the xaxis is hidden by default.
- Sets a reference between this trace's x coordinates and a 2D cartesian x axis. If x (the default value), the x coordinates refer to
layout.xaxis. If x2, the x coordinates refer tolayout.xaxis2, and so on. - Sets the source reference on Chart Studio Cloud for
x. - A two dimensional array of y coordinates at each carpet point.
- Sets a reference between this trace's y coordinates and a 2D cartesian y axis. If y (the default value), the y coordinates refer to
layout.yaxis. If y2, the y coordinates refer tolayout.yaxis2, and so on. - Sets the source reference on Chart Studio Cloud for
y. - Sets the layer on which this trace is displayed, relative to other SVG traces on the same subplot. SVG traces with higher
zorderappear in front of those with lowerzorder.