Funnelarea
Overview
The funnelarea trace type is used to create funnel area charts, which are similar to funnel charts but are represented as a circular area instead of a linear progression. Funnel area charts are useful for comparing stages in a process with proportional sizes. Each stage is represented as a sector of a circle, and its size represents the magnitude of the data.
You can control the colors, labels, and orientation of the funnel area sections to visualize proportional data across different stages.
Common Uses
- Proportional Stages: Showing the proportion of data at each stage in a circular format.
- Conversion Rates: Visualizing the drop-off rates in different stages of a process.
- Sales and Marketing Funnels: Representing funnels like leads-to-sales in a circular format.
Check out the Attributes for the full set of configuration options
Examples
Common Configurations
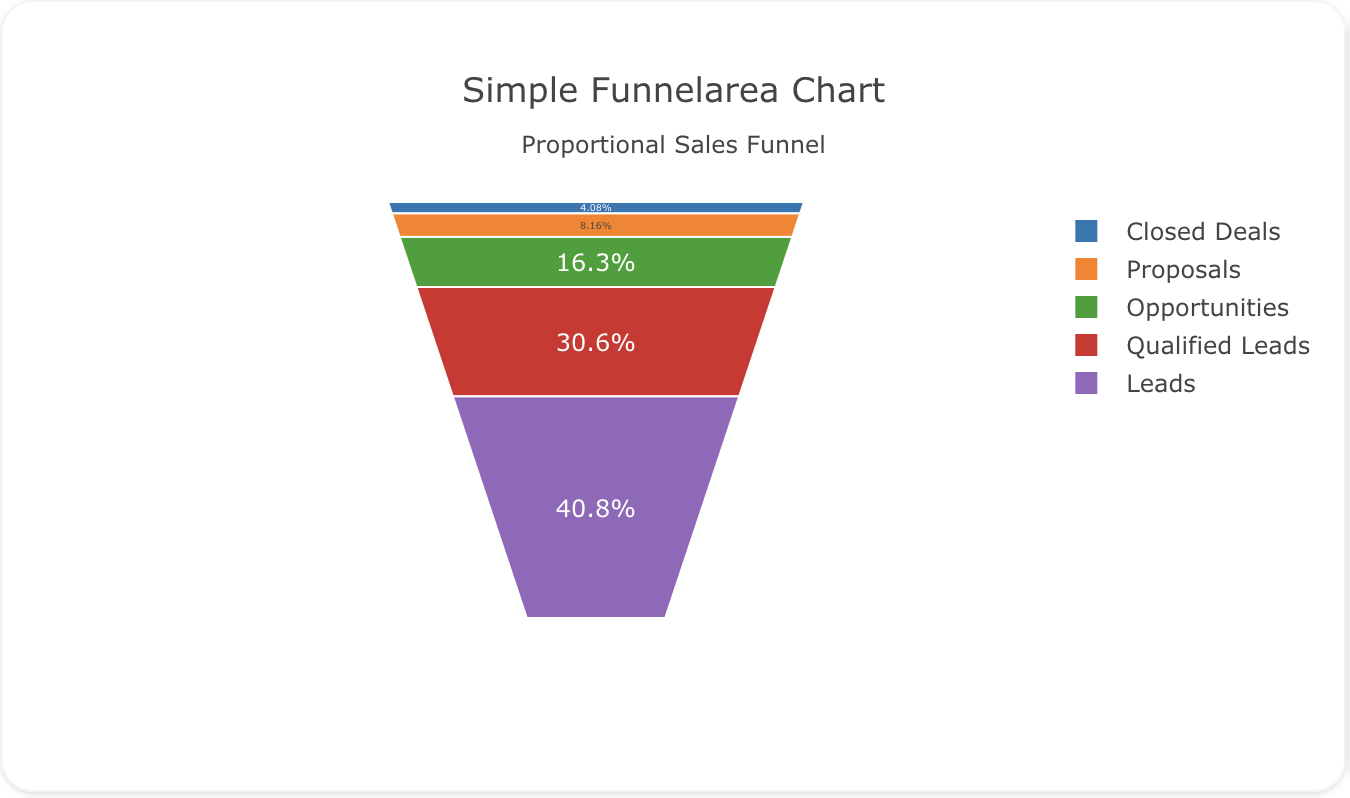
Here's a simple funnelarea plot showing data in a circular funnel format:
You can copy this code below to create this chart in your project:
models:
  - name: funnelarea-data
    args:
      - echo
      - |
        stage,value
        Leads,1000
        Qualified Leads,750
        Opportunities,400
        Proposals,200
        Closed Deals,100
traces:
  - name: Simple Funnelarea Plot
    model: ${ref(funnelarea-data)}
    props:
      type: funnelarea
      labels: ?{stage}
      values: ?{value}
charts:
  - name: Simple Funnelarea Chart
    traces:
      - ${ref(Simple Funnelarea Plot)}
    layout:
      title:
        text: Simple Funnelarea Chart<br><sub>Proportional Sales Funnel</sub>
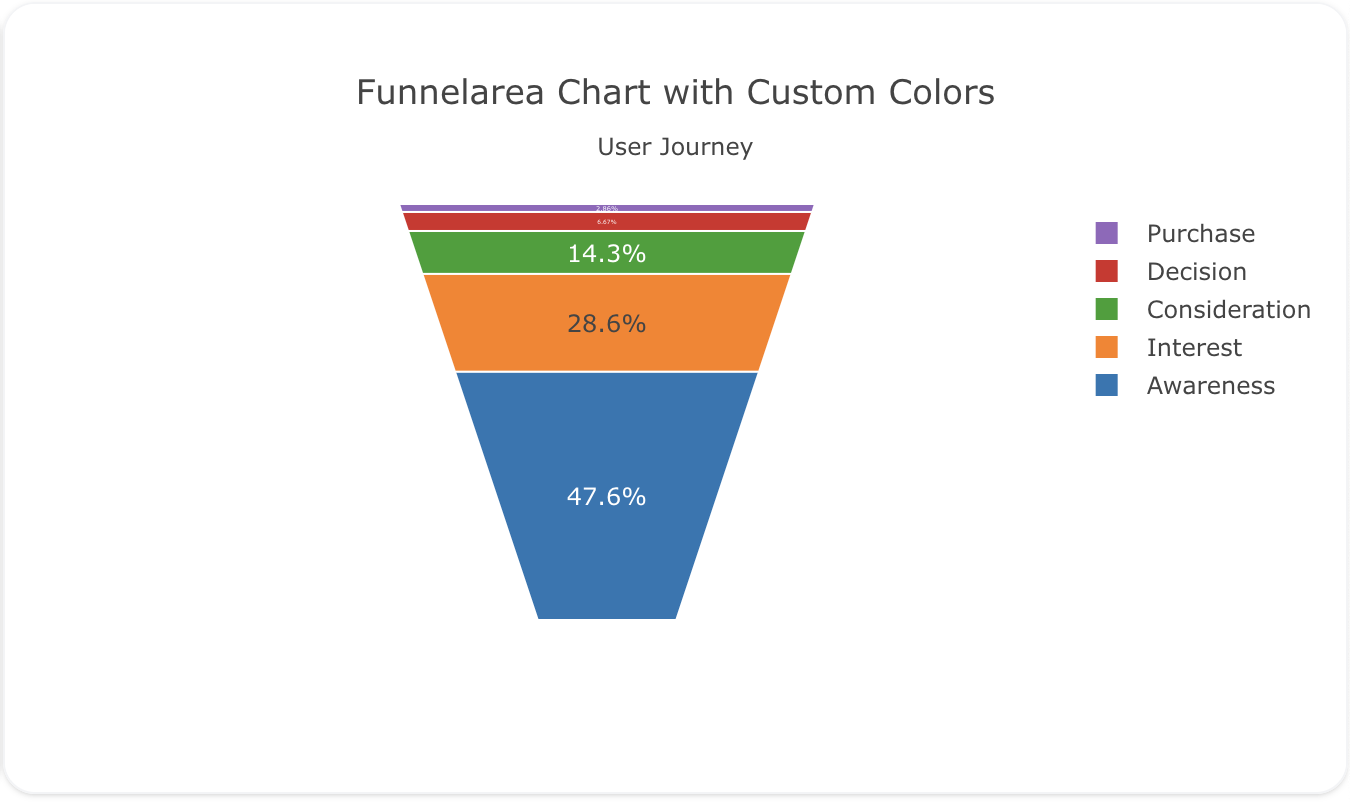
This example shows a funnelarea plot where each stage has a custom color for better differentiation:
Here's the code:
models:
  - name: funnelarea-data-custom
    args:
      - echo
      - |
        stage,value,color
        Awareness,5000,"#1f77b4"
        Interest,3000,"#ff7f0e"
        Consideration,1500,"#2ca02c"
        Decision,700,"#d62728"
        Purchase,300,"#9467bd"
traces:
  - name: Custom Colors Funnelarea Plot
    model: ${ref(funnelarea-data-custom)}
    props:
      type: funnelarea
      labels: ?{stage}
      values: ?{value}
      marker:
        colors: ?{color}
charts:
  - name: Funnelarea Chart with Custom Colors
    traces:
      - ${ref(Custom Colors Funnelarea Plot)}
    layout:
      title:
        text: Funnelarea Chart with Custom Colors<br><sub>User Journey</sub>
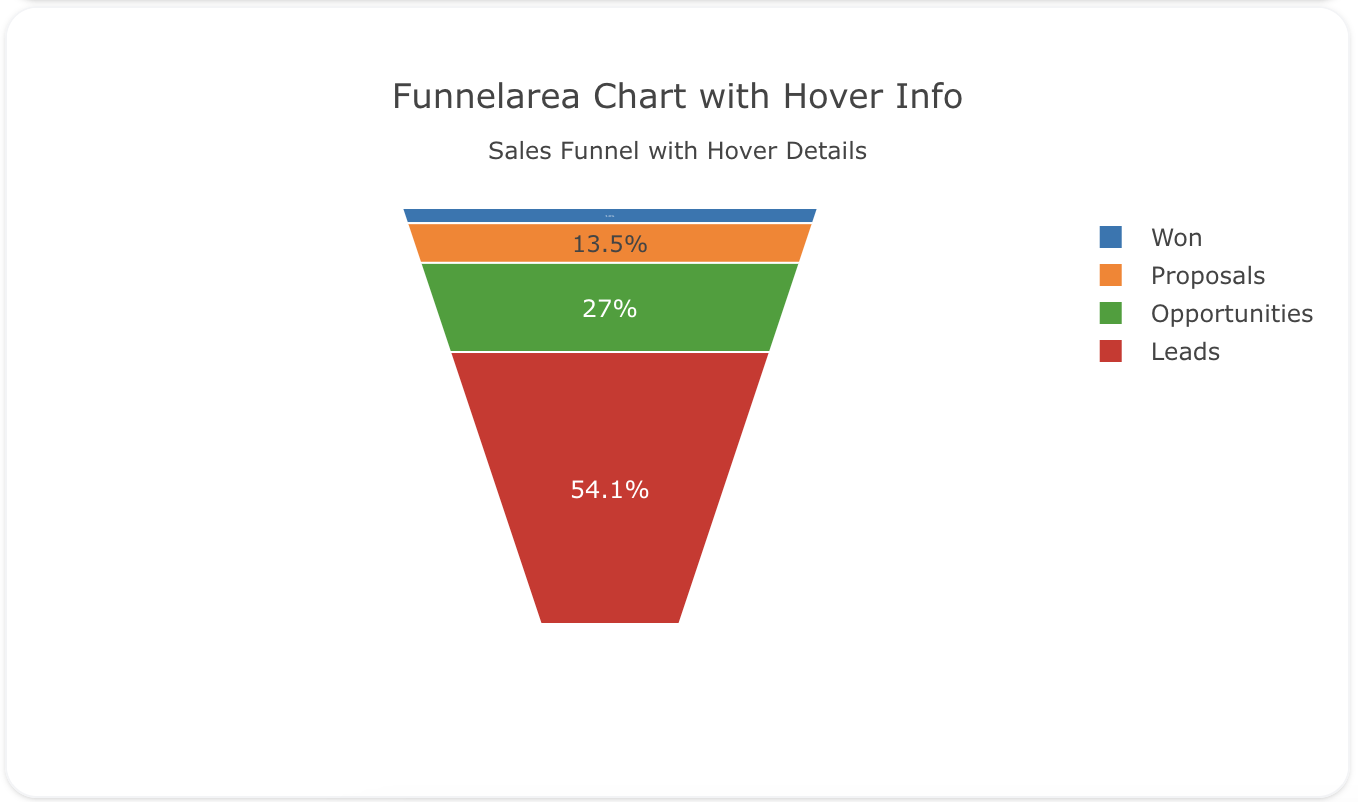
This example demonstrates a funnelarea plot with hover information to show the value and percentage for each stage:
Here's the code:
models:
  - name: funnelarea-data-hover
    args:
      - echo
      - |
        stage,value
        Leads,1000
        Opportunities,500
        Proposals,250
        Won,100
traces:
  - name: Funnelarea Plot with Hover Info
    model: ${ref(funnelarea-data-hover)}
    props:
      type: funnelarea
      labels: ?{stage}
      values: ?{value}
      hoverinfo: "label+value+percent"
charts:
  - name: Funnelarea Chart with Hover Info
    traces:
      - ${ref(Funnelarea Plot with Hover Info)}
    layout:
      title:
        text: Funnelarea Chart with Hover Info<br><sub>Sales Funnel with Hover Details</sub>
A schema to validate plotly trace properties
Attributes
These attributes apply to traces where trace.props.type is set to funnelarea. You would configure these attributes on the trace with the trace.props object.
aspectratio: 'number' #(1)!
baseratio: 'number' #(2)!
customdata: 'array' #(3)!
customdatasrc: 'string' #(4)!
dlabel: 'number' #(5)!
domain:
  column: 'integer' #(6)!
  row: 'integer' #(7)!
  x: 'array' #(8)!
  y: 'array' #(9)!
hoverinfo: 'array' #(10)!
hoverinfosrc: 'string' #(11)!
hoverlabel:
  align: 'array' #(12)!
  alignsrc: 'string' #(13)!
  bgcolor: 'color | array' #(14)!
  bgcolorsrc: 'string' #(15)!
  bordercolor: 'color | array' #(16)!
  bordercolorsrc: 'string' #(17)!
  font:
    color: color | array
    colorsrc: 'string' #(18)!
    family: 'string | array' #(19)!
    familysrc: 'string' #(20)!
    lineposition: 'array' #(21)!
    linepositionsrc: 'string' #(22)!
    shadow: 'string | array' #(23)!
    shadowsrc: 'string' #(24)!
    size: number | array
    sizesrc: 'string' #(25)!
    style: 'array' #(26)!
    stylesrc: 'string' #(27)!
    textcase: 'array' #(28)!
    textcasesrc: 'string' #(29)!
    variant: 'array' #(30)!
    variantsrc: 'string' #(31)!
    weight: 'integer | array' #(32)!
    weightsrc: 'string' #(33)!
  namelength: 'integer | array' #(34)!
  namelengthsrc: 'string' #(35)!
hovertemplate: 'string | array' #(36)!
hovertemplatesrc: 'string' #(37)!
hovertext: 'string | array' #(38)!
hovertextsrc: 'string' #(39)!
ids: 'array' #(40)!
idssrc: 'string' #(41)!
insidetextfont:
  color: color | array
  colorsrc: 'string' #(42)!
  family: 'string | array' #(43)!
  familysrc: 'string' #(44)!
  lineposition: 'array' #(45)!
  linepositionsrc: 'string' #(46)!
  shadow: 'string | array' #(47)!
  shadowsrc: 'string' #(48)!
  size: number | array
  sizesrc: 'string' #(49)!
  style: 'array' #(50)!
  stylesrc: 'string' #(51)!
  textcase: 'array' #(52)!
  textcasesrc: 'string' #(53)!
  variant: 'array' #(54)!
  variantsrc: 'string' #(55)!
  weight: 'integer | array' #(56)!
  weightsrc: 'string' #(57)!
label0: 'number' #(58)!
labels: 'array' #(59)!
labelssrc: 'string' #(60)!
legend: 'string' #(61)!
legendgroup: 'string' #(62)!
legendgrouptitle:
  font:
    color: any
    family: 'string' #(63)!
    lineposition: 'string' #(64)!
    shadow: 'string' #(65)!
    size: number
    style: 'any' #(66)!
    textcase: 'any' #(67)!
    variant: 'any' #(68)!
    weight: 'integer' #(69)!
  text: 'string' #(70)!
legendrank: 'number' #(71)!
legendwidth: 'number' #(72)!
marker:
  colors: 'array' #(73)!
  colorssrc: 'string' #(74)!
  line:
    color: 'color | array' #(75)!
    colorsrc: 'string' #(76)!
    width: 'number | array' #(77)!
    widthsrc: 'string' #(78)!
  pattern:
    bgcolor: 'color | array' #(79)!
    bgcolorsrc: 'string' #(80)!
    fgcolor: 'color | array' #(81)!
    fgcolorsrc: 'string' #(82)!
    fgopacity: 'number' #(83)!
    fillmode: 'any' #(84)!
    shape: 'array' #(85)!
    shapesrc: 'string' #(86)!
    size: 'number | array' #(87)!
    sizesrc: 'string' #(88)!
    solidity: 'number | array' #(89)!
    soliditysrc: 'string' #(90)!
metasrc: 'string' #(91)!
name: 'string' #(92)!
opacity: 'number' #(93)!
scalegroup: 'string' #(94)!
showlegend: 'boolean' #(95)!
stream:
  maxpoints: 'number' #(96)!
  token: 'string' #(97)!
text: 'array' #(98)!
textfont:
  color: color | array
  colorsrc: 'string' #(99)!
  family: 'string | array' #(100)!
  familysrc: 'string' #(101)!
  lineposition: 'array' #(102)!
  linepositionsrc: 'string' #(103)!
  shadow: 'string | array' #(104)!
  shadowsrc: 'string' #(105)!
  size: number | array
  sizesrc: 'string' #(106)!
  style: 'array' #(107)!
  stylesrc: 'string' #(108)!
  textcase: 'array' #(109)!
  textcasesrc: 'string' #(110)!
  variant: 'array' #(111)!
  variantsrc: 'string' #(112)!
  weight: 'integer | array' #(113)!
  weightsrc: 'string' #(114)!
textinfo: 'string' #(115)!
textposition: 'array' #(116)!
textpositionsrc: 'string' #(117)!
textsrc: 'string' #(118)!
texttemplate: 'string | array' #(119)!
texttemplatesrc: 'string' #(120)!
title:
  font:
    color: color | array
    colorsrc: 'string' #(121)!
    family: 'string | array' #(122)!
    familysrc: 'string' #(123)!
    lineposition: 'array' #(124)!
    linepositionsrc: 'string' #(125)!
    shadow: 'string | array' #(126)!
    shadowsrc: 'string' #(127)!
    size: number | array
    sizesrc: 'string' #(128)!
    style: 'array' #(129)!
    stylesrc: 'string' #(130)!
    textcase: 'array' #(131)!
    textcasesrc: 'string' #(132)!
    variant: 'array' #(133)!
    variantsrc: 'string' #(134)!
    weight: 'integer | array' #(135)!
    weightsrc: 'string' #(136)!
  position: 'any' #(137)!
  text: 'string' #(138)!
type: funnelarea
uid: 'string' #(139)!
values: 'array' #(140)!
valuessrc: 'string' #(141)!
visible: 'any' #(142)!
- Sets the ratio between height and width
- Sets the ratio between bottom length and maximum top length.
- Assigns extra data each datum. This may be useful when listening to hover, click and selection events. Note that, scatter traces also appends customdata items in the markers DOM elements
- Sets the source reference on Chart Studio Cloud for
customdata. - Sets the label step. See
label0for more info. - If there is a layout grid, use the domain for this column in the grid for this funnelarea trace .
- If there is a layout grid, use the domain for this row in the grid for this funnelarea trace .
- Sets the horizontal domain of this funnelarea trace (in plot fraction).
- Sets the vertical domain of this funnelarea trace (in plot fraction).
- Determines which trace information appear on hover. If
noneorskipare set, no information is displayed upon hovering. But, ifnoneis set, click and hover events are still fired. - Sets the source reference on Chart Studio Cloud for
hoverinfo. - Sets the horizontal alignment of the text content within hover label box. Has an effect only if the hover label text spans more two or more lines
- Sets the source reference on Chart Studio Cloud for
align. - Sets the background color of the hover labels for this trace
- Sets the source reference on Chart Studio Cloud for
bgcolor. - Sets the border color of the hover labels for this trace.
- Sets the source reference on Chart Studio Cloud for
bordercolor. - Sets the source reference on Chart Studio Cloud for
color. - HTML font family - the typeface that will be applied by the web browser. The web browser can only apply a font if it is available on the system where it runs. Provide multiple font families, separated by commas, to indicate the order in which to apply fonts if they aren't available.
- Sets the source reference on Chart Studio Cloud for
family. - Sets the kind of decoration line(s) with text, such as an under, over or through as well as combinations e.g. under+over, etc.
- Sets the source reference on Chart Studio Cloud for
lineposition. - Sets the shape and color of the shadow behind text. auto places minimal shadow and applies contrast text font color. See https://developer.mozilla.org/en-US/docs/Web/CSS/text-shadow for additional options.
- Sets the source reference on Chart Studio Cloud for
shadow. - Sets the source reference on Chart Studio Cloud for
size. - Sets whether a font should be styled with a normal or italic face from its family.
- Sets the source reference on Chart Studio Cloud for
style. - Sets capitalization of text. It can be used to make text appear in all-uppercase or all-lowercase, or with each word capitalized.
- Sets the source reference on Chart Studio Cloud for
textcase. - Sets the variant of the font.
- Sets the source reference on Chart Studio Cloud for
variant. - Sets the weight (or boldness) of the font.
- Sets the source reference on Chart Studio Cloud for
weight. - Sets the default length (in number of characters) of the trace name in the hover labels for all traces. -1 shows the whole name regardless of length. 0-3 shows the first 0-3 characters, and an integer >3 will show the whole name if it is less than that many characters, but if it is longer, will truncate to
namelength - 3characters and add an ellipsis. - Sets the source reference on Chart Studio Cloud for
namelength. - Template string used for rendering the information that appear on hover box. Note that this will override
hoverinfo. Variables are inserted using %{variable}, for example "y: %{y}" as well as %{xother}, {%xother}, {%_xother}, {%xother_}. When showing info for several points, xother will be added to those with different x positions from the first point. An underscore before or after (x|y)other will add a space on that side, only when this field is shown. Numbers are formatted using d3-format's syntax %{variable:d3-format}, for example "Price: %{y:$.2f}". https://github.com/d3/d3-format/tree/v1.4.5#d3-format for details on the formatting syntax. Dates are formatted using d3-time-format's syntax %{variable|d3-time-format}, for example "Day: %{2019-01-01|%A}". https://github.com/d3/d3-time-format/tree/v2.2.3#locale_format for details on the date formatting syntax. The variables available inhovertemplateare the ones emitted as event data described at this link https://plotly.com/javascript/plotlyjs-events/#event-data. Additionally, every attributes that can be specified per-point (the ones that arearrayOk: true) are available. Finally, the template string has access to variableslabel,color,value,textandpercent. Anything contained in tag<extra>is displayed in the secondary box, for example "{fullData.name} ". To hide the secondary box completely, use an empty tag<extra></extra>. - Sets the source reference on Chart Studio Cloud for
hovertemplate. - Sets hover text elements associated with each sector. If a single string, the same string appears for all data points. If an array of string, the items are mapped in order of this trace's sectors. To be seen, trace
hoverinfomust contain a text flag. - Sets the source reference on Chart Studio Cloud for
hovertext. - Assigns id labels to each datum. These ids for object constancy of data points during animation. Should be an array of strings, not numbers or any other type.
- Sets the source reference on Chart Studio Cloud for
ids. - Sets the source reference on Chart Studio Cloud for
color. - HTML font family - the typeface that will be applied by the web browser. The web browser can only apply a font if it is available on the system where it runs. Provide multiple font families, separated by commas, to indicate the order in which to apply fonts if they aren't available.
- Sets the source reference on Chart Studio Cloud for
family. - Sets the kind of decoration line(s) with text, such as an under, over or through as well as combinations e.g. under+over, etc.
- Sets the source reference on Chart Studio Cloud for
lineposition. - Sets the shape and color of the shadow behind text. auto places minimal shadow and applies contrast text font color. See https://developer.mozilla.org/en-US/docs/Web/CSS/text-shadow for additional options.
- Sets the source reference on Chart Studio Cloud for
shadow. - Sets the source reference on Chart Studio Cloud for
size. - Sets whether a font should be styled with a normal or italic face from its family.
- Sets the source reference on Chart Studio Cloud for
style. - Sets capitalization of text. It can be used to make text appear in all-uppercase or all-lowercase, or with each word capitalized.
- Sets the source reference on Chart Studio Cloud for
textcase. - Sets the variant of the font.
- Sets the source reference on Chart Studio Cloud for
variant. - Sets the weight (or boldness) of the font.
- Sets the source reference on Chart Studio Cloud for
weight. - Alternate to
labels. Builds a numeric set of labels. Use withdlabelwherelabel0is the starting label anddlabelthe step. - Sets the sector labels. If
labelsentries are duplicated, we sum associatedvaluesor simply count occurrences ifvaluesis not provided. For other array attributes (including color) we use the first non-empty entry among all occurrences of the label. - Sets the source reference on Chart Studio Cloud for
labels. - Sets the reference to a legend to show this trace in. References to these legends are legend, legend2, legend3, etc. Settings for these legends are set in the layout, under
layout.legend,layout.legend2, etc. - Sets the legend group for this trace. Traces and shapes part of the same legend group hide/show at the same time when toggling legend items.
- HTML font family - the typeface that will be applied by the web browser. The web browser can only apply a font if it is available on the system where it runs. Provide multiple font families, separated by commas, to indicate the order in which to apply fonts if they aren't available.
- Sets the kind of decoration line(s) with text, such as an under, over or through as well as combinations e.g. under+over, etc.
- Sets the shape and color of the shadow behind text. auto places minimal shadow and applies contrast text font color. See https://developer.mozilla.org/en-US/docs/Web/CSS/text-shadow for additional options.
- Sets whether a font should be styled with a normal or italic face from its family.
- Sets capitalization of text. It can be used to make text appear in all-uppercase or all-lowercase, or with each word capitalized.
- Sets the variant of the font.
- Sets the weight (or boldness) of the font.
- Sets the title of the legend group.
- Sets the legend rank for this trace. Items and groups with smaller ranks are presented on top/left side while with reversed
legend.traceorderthey are on bottom/right side. The default legendrank is 1000, so that you can use ranks less than 1000 to place certain items before all unranked items, and ranks greater than 1000 to go after all unranked items. When having unranked or equal rank items shapes would be displayed after traces i.e. according to their order in data and layout. - Sets the width (in px or fraction) of the legend for this trace.
- Sets the color of each sector. If not specified, the default trace color set is used to pick the sector colors.
- Sets the source reference on Chart Studio Cloud for
colors. - Sets the color of the line enclosing each sector. Defaults to the
paper_bgcolorvalue. - Sets the source reference on Chart Studio Cloud for
color. - Sets the width (in px) of the line enclosing each sector.
- Sets the source reference on Chart Studio Cloud for
width. - When there is no colorscale sets the color of background pattern fill. Defaults to a
marker.colorbackground whenfillmodeis overlay. Otherwise, defaults to a transparent background. - Sets the source reference on Chart Studio Cloud for
bgcolor. - When there is no colorscale sets the color of foreground pattern fill. Defaults to a
marker.colorbackground whenfillmodeis replace. Otherwise, defaults to dark grey or white to increase contrast with thebgcolor. - Sets the source reference on Chart Studio Cloud for
fgcolor. - Sets the opacity of the foreground pattern fill. Defaults to a 0.5 when
fillmodeis overlay. Otherwise, defaults to 1. - Determines whether
marker.colorshould be used as a default tobgcoloror afgcolor. - Sets the shape of the pattern fill. By default, no pattern is used for filling the area.
- Sets the source reference on Chart Studio Cloud for
shape. - Sets the size of unit squares of the pattern fill in pixels, which corresponds to the interval of repetition of the pattern.
- Sets the source reference on Chart Studio Cloud for
size. - Sets the solidity of the pattern fill. Solidity is roughly the fraction of the area filled by the pattern. Solidity of 0 shows only the background color without pattern and solidty of 1 shows only the foreground color without pattern.
- Sets the source reference on Chart Studio Cloud for
solidity. - Sets the source reference on Chart Studio Cloud for
meta. - Sets the trace name. The trace name appears as the legend item and on hover.
- Sets the opacity of the trace.
- If there are multiple funnelareas that should be sized according to their totals, link them by providing a non-empty group id here shared by every trace in the same group.
- Determines whether or not an item corresponding to this trace is shown in the legend.
- Sets the maximum number of points to keep on the plots from an incoming stream. If
maxpointsis set to 50, only the newest 50 points will be displayed on the plot. - The stream id number links a data trace on a plot with a stream. See https://chart-studio.plotly.com/settings for more details.
- Sets text elements associated with each sector. If trace
textinfocontains a text flag, these elements will be seen on the chart. If tracehoverinfocontains a text flag and hovertext is not set, these elements will be seen in the hover labels. - Sets the source reference on Chart Studio Cloud for
color. - HTML font family - the typeface that will be applied by the web browser. The web browser can only apply a font if it is available on the system where it runs. Provide multiple font families, separated by commas, to indicate the order in which to apply fonts if they aren't available.
- Sets the source reference on Chart Studio Cloud for
family. - Sets the kind of decoration line(s) with text, such as an under, over or through as well as combinations e.g. under+over, etc.
- Sets the source reference on Chart Studio Cloud for
lineposition. - Sets the shape and color of the shadow behind text. auto places minimal shadow and applies contrast text font color. See https://developer.mozilla.org/en-US/docs/Web/CSS/text-shadow for additional options.
- Sets the source reference on Chart Studio Cloud for
shadow. - Sets the source reference on Chart Studio Cloud for
size. - Sets whether a font should be styled with a normal or italic face from its family.
- Sets the source reference on Chart Studio Cloud for
style. - Sets capitalization of text. It can be used to make text appear in all-uppercase or all-lowercase, or with each word capitalized.
- Sets the source reference on Chart Studio Cloud for
textcase. - Sets the variant of the font.
- Sets the source reference on Chart Studio Cloud for
variant. - Sets the weight (or boldness) of the font.
- Sets the source reference on Chart Studio Cloud for
weight. - Determines which trace information appear on the graph.
- Specifies the location of the
textinfo. - Sets the source reference on Chart Studio Cloud for
textposition. - Sets the source reference on Chart Studio Cloud for
text. - Template string used for rendering the information text that appear on points. Note that this will override
textinfo. Variables are inserted using %{variable}, for example "y: %{y}". Numbers are formatted using d3-format's syntax %{variable:d3-format}, for example "Price: %{y:$.2f}". https://github.com/d3/d3-format/tree/v1.4.5#d3-format for details on the formatting syntax. Dates are formatted using d3-time-format's syntax %{variable|d3-time-format}, for example "Day: %{2019-01-01|%A}". https://github.com/d3/d3-time-format/tree/v2.2.3#locale_format for details on the date formatting syntax. Every attributes that can be specified per-point (the ones that arearrayOk: true) are available. Finally, the template string has access to variableslabel,color,value,textandpercent. - Sets the source reference on Chart Studio Cloud for
texttemplate. - Sets the source reference on Chart Studio Cloud for
color. - HTML font family - the typeface that will be applied by the web browser. The web browser can only apply a font if it is available on the system where it runs. Provide multiple font families, separated by commas, to indicate the order in which to apply fonts if they aren't available.
- Sets the source reference on Chart Studio Cloud for
family. - Sets the kind of decoration line(s) with text, such as an under, over or through as well as combinations e.g. under+over, etc.
- Sets the source reference on Chart Studio Cloud for
lineposition. - Sets the shape and color of the shadow behind text. auto places minimal shadow and applies contrast text font color. See https://developer.mozilla.org/en-US/docs/Web/CSS/text-shadow for additional options.
- Sets the source reference on Chart Studio Cloud for
shadow. - Sets the source reference on Chart Studio Cloud for
size. - Sets whether a font should be styled with a normal or italic face from its family.
- Sets the source reference on Chart Studio Cloud for
style. - Sets capitalization of text. It can be used to make text appear in all-uppercase or all-lowercase, or with each word capitalized.
- Sets the source reference on Chart Studio Cloud for
textcase. - Sets the variant of the font.
- Sets the source reference on Chart Studio Cloud for
variant. - Sets the weight (or boldness) of the font.
- Sets the source reference on Chart Studio Cloud for
weight. - Specifies the location of the
title. - Sets the title of the chart. If it is empty, no title is displayed.
- Assign an id to this trace, Use this to provide object constancy between traces during animations and transitions.
- Sets the values of the sectors. If omitted, we count occurrences of each label.
- Sets the source reference on Chart Studio Cloud for
values. - Determines whether or not this trace is visible. If legendonly, the trace is not drawn, but can appear as a legend item (provided that the legend itself is visible).