Icicle
Overview
The icicle trace type is used to create icicle charts, which are a variation of treemap charts but arranged vertically. Icicle charts are useful for visualizing hierarchical data, where each branch represents a part of the whole, and you can drill down into sub-categories.
You can customize the colors, labels, and depth of the icicle chart to represent your hierarchical data effectively.
Common Uses
- Hierarchical Data Representation: Visualizing categories and subcategories in a hierarchy.
- Part-to-Whole Relationships: Showing how parts relate to the whole, with breakdowns for subcategories.
- Drill-Down Analysis: Allowing users to explore different levels of data.
Check out the Attributes for the full set of configuration options
Examples
Common Configurations
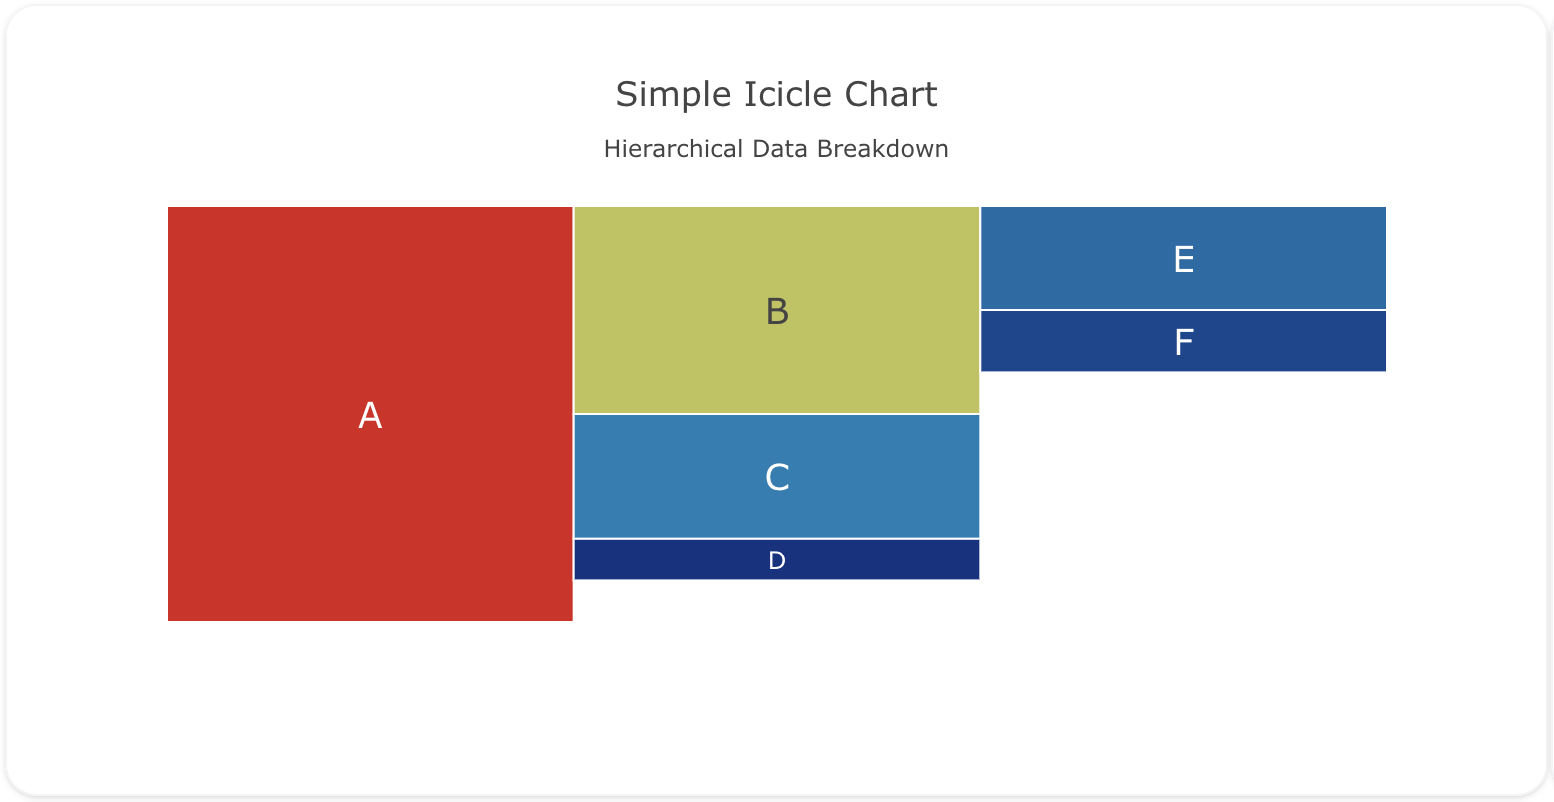
Here's a simple icicle plot showing hierarchical data, with branches representing categories:
You can copy this code below to create this chart in your project:
models:
  - name: icicle-data
    args:
      - echo
      - |
        category,parent,value
        A,,100
        B,A,50
        C,A,30
        D,A,10
        E,B,25
        F,B,15
traces:
  - name: Simple Icicle Plot
    model: ${ref(icicle-data)}
    props:
      type: icicle
      labels: ?{category}
      parents: ?{parent}
      values: ?{value}
      branchvalues: "total"
      marker:
        colorscale: "Portland"
      textposition: "middle center"
      textfont:
        size: 18
charts:
  - name: Simple Icicle Chart
    traces:
      - ${ref(Simple Icicle Plot)}
    layout:
      title:
        text: Simple Icicle Chart<br><sub>Hierarchical Data Breakdown</sub>
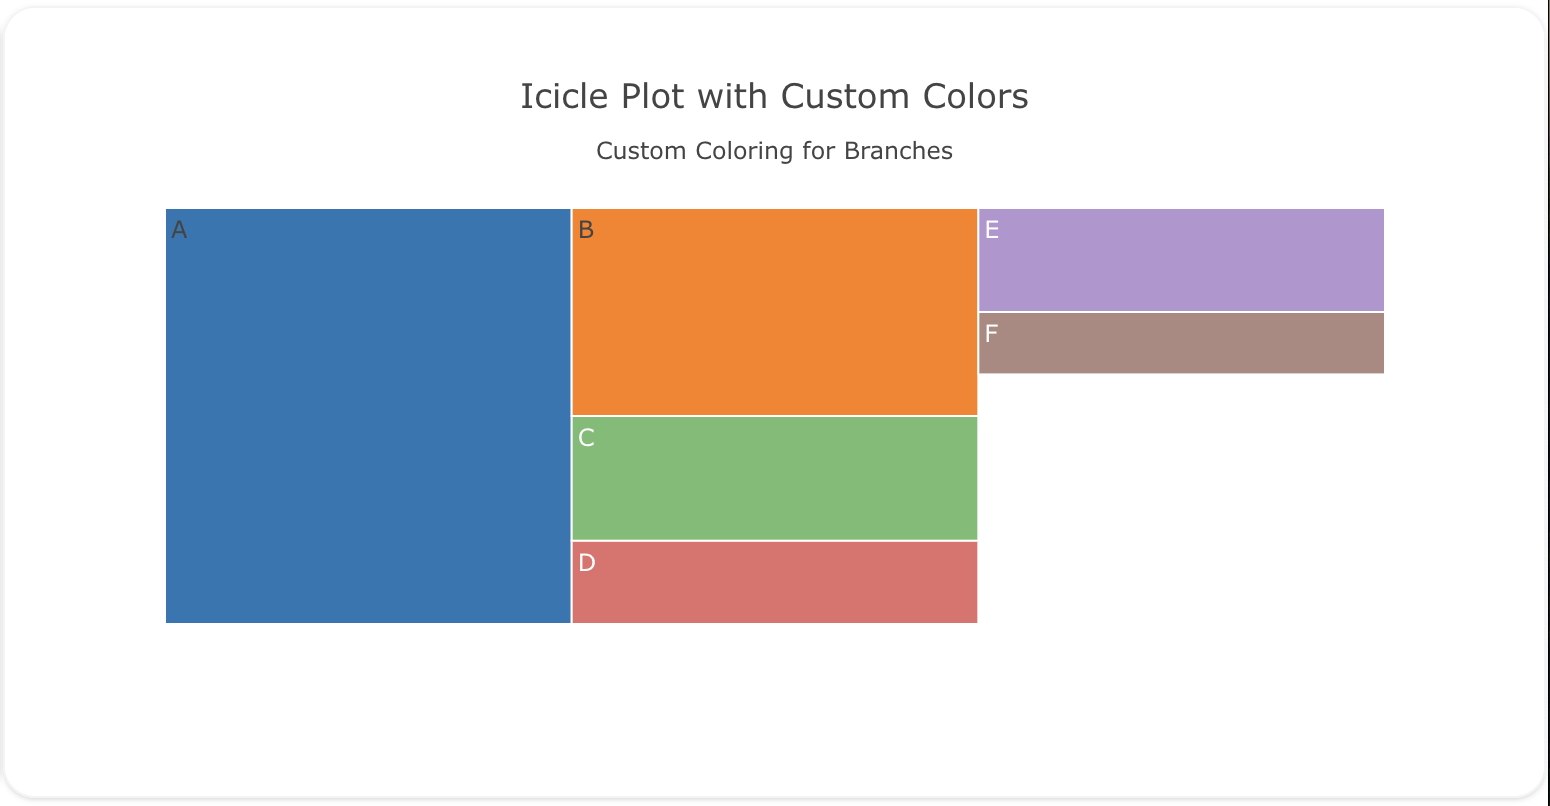
This example demonstrates a icicle plot with custom colors for each branch and leaf node:
Here's the code:
models:
  - name: icicle-data-custom
    args:
      - echo
      - |
        category,parent,value,color
        A,,100,"#1f77b4"
        B,A,50,"#ff7f0e"
        C,A,30,"#2ca02c"
        D,A,20,"#d62728"
        E,B,25,"#9467bd"
        F,B,15,"#8c564b"
traces:
  - name: Custom Colors Icicle Plot
    model: ${ref(icicle-data-custom)}
    props:
      type: icicle
      labels: ?{category}
      parents: ?{parent}
      values: ?{value}
      marker:
        colors: ?{color}
      branchvalues: "total"
charts:
  - name: Custom Colors Icicle Chart
    traces:
      - ${ref(Custom Colors Icicle Plot)}
    layout:
      title:
        text: Icicle Plot with Custom Colors<br><sub>Custom Coloring for Branches</sub>
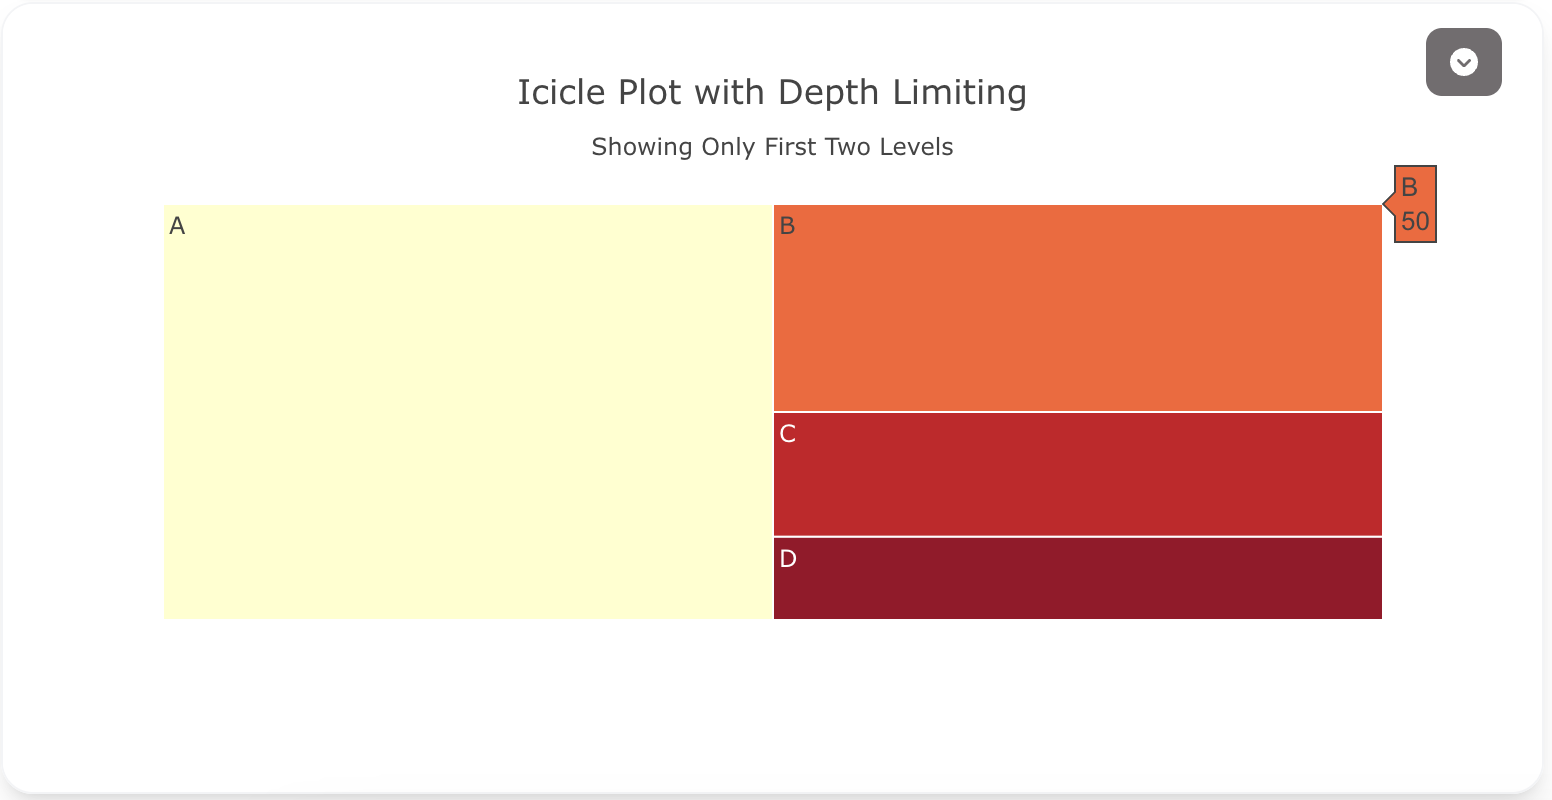
This example shows an icicle plot with depth limiting, allowing the user to only see the first two levels of the hierarchy:
Here's the code:
models:
  - name: icicle-data-depth
    args:
      - echo
      - |
        category,parent,value
        A,,100
        B,A,50
        C,A,30
        D,A,20
        E,B,25
        F,B,15
traces:
  - name: Icicle Plot with Depth Limiting Trace
    model: ${ref(icicle-data-depth)}
    props:
      type: icicle
      labels: ?{category}
      parents: ?{parent}
      values: ?{value}
      maxdepth: 2
      branchvalues: "total"
      marker:
        colorscale: "YlOrRd"
charts:
  - name: Icicle Plot with Depth Limiting
    traces:
      - ${ref(Icicle Plot with Depth Limiting Trace)}
    layout:
      title:
        text: Icicle Plot with Depth Limiting<br><sub>Showing Only First Two Levels</sub>
A schema to validate plotly trace properties
Attributes
These attributes apply to traces where trace.props.type is set to icicle. You would configure these attributes on the trace with the trace.props object.
branchvalues: 'any' #(1)!
count: 'string' #(2)!
customdata: 'array' #(3)!
customdatasrc: 'string' #(4)!
domain:
  column: 'integer' #(5)!
  row: 'integer' #(6)!
  x: 'array' #(7)!
  y: 'array' #(8)!
hoverinfo: 'array' #(9)!
hoverinfosrc: 'string' #(10)!
hoverlabel:
  align: 'array' #(11)!
  alignsrc: 'string' #(12)!
  bgcolor: 'color | array' #(13)!
  bgcolorsrc: 'string' #(14)!
  bordercolor: 'color | array' #(15)!
  bordercolorsrc: 'string' #(16)!
  font:
    color: color | array
    colorsrc: 'string' #(17)!
    family: 'string | array' #(18)!
    familysrc: 'string' #(19)!
    lineposition: 'array' #(20)!
    linepositionsrc: 'string' #(21)!
    shadow: 'string | array' #(22)!
    shadowsrc: 'string' #(23)!
    size: number | array
    sizesrc: 'string' #(24)!
    style: 'array' #(25)!
    stylesrc: 'string' #(26)!
    textcase: 'array' #(27)!
    textcasesrc: 'string' #(28)!
    variant: 'array' #(29)!
    variantsrc: 'string' #(30)!
    weight: 'integer | array' #(31)!
    weightsrc: 'string' #(32)!
  namelength: 'integer | array' #(33)!
  namelengthsrc: 'string' #(34)!
hovertemplate: 'string | array' #(35)!
hovertemplatesrc: 'string' #(36)!
hovertext: 'string | array' #(37)!
hovertextsrc: 'string' #(38)!
ids: 'array' #(39)!
idssrc: 'string' #(40)!
insidetextfont:
  color: color | array
  colorsrc: 'string' #(41)!
  family: 'string | array' #(42)!
  familysrc: 'string' #(43)!
  lineposition: 'array' #(44)!
  linepositionsrc: 'string' #(45)!
  shadow: 'string | array' #(46)!
  shadowsrc: 'string' #(47)!
  size: number | array
  sizesrc: 'string' #(48)!
  style: 'array' #(49)!
  stylesrc: 'string' #(50)!
  textcase: 'array' #(51)!
  textcasesrc: 'string' #(52)!
  variant: 'array' #(53)!
  variantsrc: 'string' #(54)!
  weight: 'integer | array' #(55)!
  weightsrc: 'string' #(56)!
labels: 'array' #(57)!
labelssrc: 'string' #(58)!
leaf:
  opacity: 'number' #(59)!
legend: 'string' #(60)!
legendgrouptitle:
  font:
    color: any
    family: 'string' #(61)!
    lineposition: 'string' #(62)!
    shadow: 'string' #(63)!
    size: number
    style: 'any' #(64)!
    textcase: 'any' #(65)!
    variant: 'any' #(66)!
    weight: 'integer' #(67)!
  text: 'string' #(68)!
legendrank: 'number' #(69)!
legendwidth: 'number' #(70)!
marker:
  autocolorscale: 'boolean' #(71)!
  cauto: 'boolean' #(72)!
  cmax: 'number' #(73)!
  cmid: 'number' #(74)!
  cmin: 'number' #(75)!
  coloraxis: 'string' #(76)!
  colorbar:
    bgcolor: 'any' #(77)!
    bordercolor: 'any' #(78)!
    borderwidth: 'number' #(79)!
    exponentformat: 'any' #(80)!
    len: 'number' #(81)!
    lenmode: 'any' #(82)!
    minexponent: 'number' #(83)!
    nticks: 'integer' #(84)!
    orientation: 'any' #(85)!
    outlinecolor: 'any' #(86)!
    outlinewidth: 'number' #(87)!
    separatethousands: 'boolean' #(88)!
    showexponent: 'any' #(89)!
    showticklabels: 'boolean' #(90)!
    showtickprefix: 'any' #(91)!
    showticksuffix: 'any' #(92)!
    thickness: 'number' #(93)!
    thicknessmode: 'any' #(94)!
    tickangle: 'number' #(95)!
    tickcolor: 'any' #(96)!
    tickfont:
      color: any
      family: 'string' #(97)!
      lineposition: 'string' #(98)!
      shadow: 'string' #(99)!
      size: number
      style: 'any' #(100)!
      textcase: 'any' #(101)!
      variant: 'any' #(102)!
      weight: 'integer' #(103)!
    tickformat: 'string' #(104)!
    tickformatstops: array
    ticklabeloverflow: 'any' #(105)!
    ticklabelposition: 'any' #(106)!
    ticklabelstep: 'integer' #(107)!
    ticklen: 'number' #(108)!
    tickmode: 'any' #(109)!
    tickprefix: 'string' #(110)!
    ticks: 'any' #(111)!
    ticksuffix: 'string' #(112)!
    ticktext: 'array' #(113)!
    ticktextsrc: 'string' #(114)!
    tickvals: 'array' #(115)!
    tickvalssrc: 'string' #(116)!
    tickwidth: 'number' #(117)!
    title:
      font:
        color: any
        family: 'string' #(118)!
        lineposition: 'string' #(119)!
        shadow: 'string' #(120)!
        size: number
        style: 'any' #(121)!
        textcase: 'any' #(122)!
        variant: 'any' #(123)!
        weight: 'integer' #(124)!
      side: 'any' #(125)!
      text: 'string' #(126)!
    x: 'number' #(127)!
    xanchor: 'any' #(128)!
    xpad: 'number' #(129)!
    xref: 'any' #(130)!
    y: 'number' #(131)!
    yanchor: 'any' #(132)!
    ypad: 'number' #(133)!
    yref: 'any' #(134)!
  colors: 'array' #(135)!
  colorscale: 'any' #(136)!
  colorssrc: 'string' #(137)!
  line:
    color: 'color | array' #(138)!
    colorsrc: 'string' #(139)!
    width: 'number | array' #(140)!
    widthsrc: 'string' #(141)!
  pattern:
    bgcolor: 'color | array' #(142)!
    bgcolorsrc: 'string' #(143)!
    fgcolor: 'color | array' #(144)!
    fgcolorsrc: 'string' #(145)!
    fgopacity: 'number' #(146)!
    fillmode: 'any' #(147)!
    shape: 'array' #(148)!
    shapesrc: 'string' #(149)!
    size: 'number | array' #(150)!
    sizesrc: 'string' #(151)!
    solidity: 'number | array' #(152)!
    soliditysrc: 'string' #(153)!
  reversescale: 'boolean' #(154)!
  showscale: 'boolean' #(155)!
maxdepth: 'integer' #(156)!
metasrc: 'string' #(157)!
name: 'string' #(158)!
opacity: 'number' #(159)!
outsidetextfont:
  color: color | array
  colorsrc: 'string' #(160)!
  family: 'string | array' #(161)!
  familysrc: 'string' #(162)!
  lineposition: 'array' #(163)!
  linepositionsrc: 'string' #(164)!
  shadow: 'string | array' #(165)!
  shadowsrc: 'string' #(166)!
  size: number | array
  sizesrc: 'string' #(167)!
  style: 'array' #(168)!
  stylesrc: 'string' #(169)!
  textcase: 'array' #(170)!
  textcasesrc: 'string' #(171)!
  variant: 'array' #(172)!
  variantsrc: 'string' #(173)!
  weight: 'integer | array' #(174)!
  weightsrc: 'string' #(175)!
parents: 'array' #(176)!
parentssrc: 'string' #(177)!
pathbar:
  edgeshape: 'any' #(178)!
  side: 'any' #(179)!
  textfont:
    color: color | array
    colorsrc: 'string' #(180)!
    family: 'string | array' #(181)!
    familysrc: 'string' #(182)!
    lineposition: 'array' #(183)!
    linepositionsrc: 'string' #(184)!
    shadow: 'string | array' #(185)!
    shadowsrc: 'string' #(186)!
    size: number | array
    sizesrc: 'string' #(187)!
    style: 'array' #(188)!
    stylesrc: 'string' #(189)!
    textcase: 'array' #(190)!
    textcasesrc: 'string' #(191)!
    variant: 'array' #(192)!
    variantsrc: 'string' #(193)!
    weight: 'integer | array' #(194)!
    weightsrc: 'string' #(195)!
  thickness: 'number' #(196)!
  visible: 'boolean' #(197)!
root:
  color: 'any' #(198)!
sort: 'boolean' #(199)!
stream:
  maxpoints: 'number' #(200)!
  token: 'string' #(201)!
text: 'array' #(202)!
textfont:
  color: color | array
  colorsrc: 'string' #(203)!
  family: 'string | array' #(204)!
  familysrc: 'string' #(205)!
  lineposition: 'array' #(206)!
  linepositionsrc: 'string' #(207)!
  shadow: 'string | array' #(208)!
  shadowsrc: 'string' #(209)!
  size: number | array
  sizesrc: 'string' #(210)!
  style: 'array' #(211)!
  stylesrc: 'string' #(212)!
  textcase: 'array' #(213)!
  textcasesrc: 'string' #(214)!
  variant: 'array' #(215)!
  variantsrc: 'string' #(216)!
  weight: 'integer | array' #(217)!
  weightsrc: 'string' #(218)!
textinfo: 'string' #(219)!
textposition: 'any' #(220)!
textsrc: 'string' #(221)!
texttemplate: 'string | array' #(222)!
texttemplatesrc: 'string' #(223)!
tiling:
  flip: 'string' #(224)!
  orientation: 'any' #(225)!
  pad: 'number' #(226)!
type: icicle
uid: 'string' #(227)!
values: 'array' #(228)!
valuessrc: 'string' #(229)!
visible: 'any' #(230)!
- Determines how the items in
valuesare summed. When set to total, items invaluesare taken to be value of all its descendants. When set to remainder, items invaluescorresponding to the root and the branches sectors are taken to be the extra part not part of the sum of the values at their leaves. - Determines default for
valueswhen it is not provided, by inferring a 1 for each of the leaves and/or branches, otherwise 0. - Assigns extra data each datum. This may be useful when listening to hover, click and selection events. Note that, scatter traces also appends customdata items in the markers DOM elements
- Sets the source reference on Chart Studio Cloud for
customdata. - If there is a layout grid, use the domain for this column in the grid for this icicle trace .
- If there is a layout grid, use the domain for this row in the grid for this icicle trace .
- Sets the horizontal domain of this icicle trace (in plot fraction).
- Sets the vertical domain of this icicle trace (in plot fraction).
- Determines which trace information appear on hover. If
noneorskipare set, no information is displayed upon hovering. But, ifnoneis set, click and hover events are still fired. - Sets the source reference on Chart Studio Cloud for
hoverinfo. - Sets the horizontal alignment of the text content within hover label box. Has an effect only if the hover label text spans more two or more lines
- Sets the source reference on Chart Studio Cloud for
align. - Sets the background color of the hover labels for this trace
- Sets the source reference on Chart Studio Cloud for
bgcolor. - Sets the border color of the hover labels for this trace.
- Sets the source reference on Chart Studio Cloud for
bordercolor. - Sets the source reference on Chart Studio Cloud for
color. - HTML font family - the typeface that will be applied by the web browser. The web browser can only apply a font if it is available on the system where it runs. Provide multiple font families, separated by commas, to indicate the order in which to apply fonts if they aren't available.
- Sets the source reference on Chart Studio Cloud for
family. - Sets the kind of decoration line(s) with text, such as an under, over or through as well as combinations e.g. under+over, etc.
- Sets the source reference on Chart Studio Cloud for
lineposition. - Sets the shape and color of the shadow behind text. auto places minimal shadow and applies contrast text font color. See https://developer.mozilla.org/en-US/docs/Web/CSS/text-shadow for additional options.
- Sets the source reference on Chart Studio Cloud for
shadow. - Sets the source reference on Chart Studio Cloud for
size. - Sets whether a font should be styled with a normal or italic face from its family.
- Sets the source reference on Chart Studio Cloud for
style. - Sets capitalization of text. It can be used to make text appear in all-uppercase or all-lowercase, or with each word capitalized.
- Sets the source reference on Chart Studio Cloud for
textcase. - Sets the variant of the font.
- Sets the source reference on Chart Studio Cloud for
variant. - Sets the weight (or boldness) of the font.
- Sets the source reference on Chart Studio Cloud for
weight. - Sets the default length (in number of characters) of the trace name in the hover labels for all traces. -1 shows the whole name regardless of length. 0-3 shows the first 0-3 characters, and an integer >3 will show the whole name if it is less than that many characters, but if it is longer, will truncate to
namelength - 3characters and add an ellipsis. - Sets the source reference on Chart Studio Cloud for
namelength. - Template string used for rendering the information that appear on hover box. Note that this will override
hoverinfo. Variables are inserted using %{variable}, for example "y: %{y}" as well as %{xother}, {%xother}, {%_xother}, {%xother_}. When showing info for several points, xother will be added to those with different x positions from the first point. An underscore before or after (x|y)other will add a space on that side, only when this field is shown. Numbers are formatted using d3-format's syntax %{variable:d3-format}, for example "Price: %{y:$.2f}". https://github.com/d3/d3-format/tree/v1.4.5#d3-format for details on the formatting syntax. Dates are formatted using d3-time-format's syntax %{variable|d3-time-format}, for example "Day: %{2019-01-01|%A}". https://github.com/d3/d3-time-format/tree/v2.2.3#locale_format for details on the date formatting syntax. The variables available inhovertemplateare the ones emitted as event data described at this link https://plotly.com/javascript/plotlyjs-events/#event-data. Additionally, every attributes that can be specified per-point (the ones that arearrayOk: true) are available. Finally, the template string has access to variablescurrentPath,root,entry,percentRoot,percentEntryandpercentParent. Anything contained in tag<extra>is displayed in the secondary box, for example "{fullData.name} ". To hide the secondary box completely, use an empty tag<extra></extra>. - Sets the source reference on Chart Studio Cloud for
hovertemplate. - Sets hover text elements associated with each sector. If a single string, the same string appears for all data points. If an array of string, the items are mapped in order of this trace's sectors. To be seen, trace
hoverinfomust contain a text flag. - Sets the source reference on Chart Studio Cloud for
hovertext. - Assigns id labels to each datum. These ids for object constancy of data points during animation. Should be an array of strings, not numbers or any other type.
- Sets the source reference on Chart Studio Cloud for
ids. - Sets the source reference on Chart Studio Cloud for
color. - HTML font family - the typeface that will be applied by the web browser. The web browser can only apply a font if it is available on the system where it runs. Provide multiple font families, separated by commas, to indicate the order in which to apply fonts if they aren't available.
- Sets the source reference on Chart Studio Cloud for
family. - Sets the kind of decoration line(s) with text, such as an under, over or through as well as combinations e.g. under+over, etc.
- Sets the source reference on Chart Studio Cloud for
lineposition. - Sets the shape and color of the shadow behind text. auto places minimal shadow and applies contrast text font color. See https://developer.mozilla.org/en-US/docs/Web/CSS/text-shadow for additional options.
- Sets the source reference on Chart Studio Cloud for
shadow. - Sets the source reference on Chart Studio Cloud for
size. - Sets whether a font should be styled with a normal or italic face from its family.
- Sets the source reference on Chart Studio Cloud for
style. - Sets capitalization of text. It can be used to make text appear in all-uppercase or all-lowercase, or with each word capitalized.
- Sets the source reference on Chart Studio Cloud for
textcase. - Sets the variant of the font.
- Sets the source reference on Chart Studio Cloud for
variant. - Sets the weight (or boldness) of the font.
- Sets the source reference on Chart Studio Cloud for
weight. - Sets the labels of each of the sectors.
- Sets the source reference on Chart Studio Cloud for
labels. - Sets the opacity of the leaves. With colorscale it is defaulted to 1; otherwise it is defaulted to 0.7
- Sets the reference to a legend to show this trace in. References to these legends are legend, legend2, legend3, etc. Settings for these legends are set in the layout, under
layout.legend,layout.legend2, etc. - HTML font family - the typeface that will be applied by the web browser. The web browser can only apply a font if it is available on the system where it runs. Provide multiple font families, separated by commas, to indicate the order in which to apply fonts if they aren't available.
- Sets the kind of decoration line(s) with text, such as an under, over or through as well as combinations e.g. under+over, etc.
- Sets the shape and color of the shadow behind text. auto places minimal shadow and applies contrast text font color. See https://developer.mozilla.org/en-US/docs/Web/CSS/text-shadow for additional options.
- Sets whether a font should be styled with a normal or italic face from its family.
- Sets capitalization of text. It can be used to make text appear in all-uppercase or all-lowercase, or with each word capitalized.
- Sets the variant of the font.
- Sets the weight (or boldness) of the font.
- Sets the title of the legend group.
- Sets the legend rank for this trace. Items and groups with smaller ranks are presented on top/left side while with reversed
legend.traceorderthey are on bottom/right side. The default legendrank is 1000, so that you can use ranks less than 1000 to place certain items before all unranked items, and ranks greater than 1000 to go after all unranked items. When having unranked or equal rank items shapes would be displayed after traces i.e. according to their order in data and layout. - Sets the width (in px or fraction) of the legend for this trace.
- Determines whether the colorscale is a default palette (
autocolorscale: true) or the palette determined bymarker.colorscale. Has an effect only if colors is set to a numerical array. In casecolorscaleis unspecified orautocolorscaleis true, the default palette will be chosen according to whether numbers in thecolorarray are all positive, all negative or mixed. - Determines whether or not the color domain is computed with respect to the input data (here colors) or the bounds set in
marker.cminandmarker.cmaxHas an effect only if colors is set to a numerical array. Defaults tofalsewhenmarker.cminandmarker.cmaxare set by the user. - Sets the upper bound of the color domain. Has an effect only if colors is set to a numerical array. Value should have the same units as colors and if set,
marker.cminmust be set as well. - Sets the mid-point of the color domain by scaling
marker.cminand/ormarker.cmaxto be equidistant to this point. Has an effect only if colors is set to a numerical array. Value should have the same units as colors. Has no effect whenmarker.cautoisfalse. - Sets the lower bound of the color domain. Has an effect only if colors is set to a numerical array. Value should have the same units as colors and if set,
marker.cmaxmust be set as well. - Sets a reference to a shared color axis. References to these shared color axes are coloraxis, coloraxis2, coloraxis3, etc. Settings for these shared color axes are set in the layout, under
layout.coloraxis,layout.coloraxis2, etc. Note that multiple color scales can be linked to the same color axis. - Sets the color of padded area.
- Sets the axis line color.
- Sets the width (in px) or the border enclosing this color bar.
- Determines a formatting rule for the tick exponents. For example, consider the number 1,000,000,000. If none, it appears as 1,000,000,000. If e, 1e+9. If E, 1E+9. If power, 1x10^9 (with 9 in a super script). If SI, 1G. If B, 1B.
- Sets the length of the color bar This measure excludes the padding of both ends. That is, the color bar length is this length minus the padding on both ends.
- Determines whether this color bar's length (i.e. the measure in the color variation direction) is set in units of plot fraction or in *pixels. Use
lento set the value. - Hide SI prefix for 10^n if |n| is below this number. This only has an effect when
tickformatis SI or B. - Specifies the maximum number of ticks for the particular axis. The actual number of ticks will be chosen automatically to be less than or equal to
nticks. Has an effect only iftickmodeis set to auto. - Sets the orientation of the colorbar.
- Sets the axis line color.
- Sets the width (in px) of the axis line.
- If "true", even 4-digit integers are separated
- If all, all exponents are shown besides their significands. If first, only the exponent of the first tick is shown. If last, only the exponent of the last tick is shown. If none, no exponents appear.
- Determines whether or not the tick labels are drawn.
- If all, all tick labels are displayed with a prefix. If first, only the first tick is displayed with a prefix. If last, only the last tick is displayed with a suffix. If none, tick prefixes are hidden.
- Same as
showtickprefixbut for tick suffixes. - Sets the thickness of the color bar This measure excludes the size of the padding, ticks and labels.
- Determines whether this color bar's thickness (i.e. the measure in the constant color direction) is set in units of plot fraction or in pixels. Use
thicknessto set the value. - Sets the angle of the tick labels with respect to the horizontal. For example, a
tickangleof -90 draws the tick labels vertically. - Sets the tick color.
- HTML font family - the typeface that will be applied by the web browser. The web browser can only apply a font if it is available on the system where it runs. Provide multiple font families, separated by commas, to indicate the order in which to apply fonts if they aren't available.
- Sets the kind of decoration line(s) with text, such as an under, over or through as well as combinations e.g. under+over, etc.
- Sets the shape and color of the shadow behind text. auto places minimal shadow and applies contrast text font color. See https://developer.mozilla.org/en-US/docs/Web/CSS/text-shadow for additional options.
- Sets whether a font should be styled with a normal or italic face from its family.
- Sets capitalization of text. It can be used to make text appear in all-uppercase or all-lowercase, or with each word capitalized.
- Sets the variant of the font.
- Sets the weight (or boldness) of the font.
- Sets the tick label formatting rule using d3 formatting mini-languages which are very similar to those in Python. For numbers, see: https://github.com/d3/d3-format/tree/v1.4.5#d3-format. And for dates see: https://github.com/d3/d3-time-format/tree/v2.2.3#locale_format. We add two items to d3's date formatter: %h for half of the year as a decimal number as well as %{n}f for fractional seconds with n digits. For example, 2016-10-13 09:15:23.456 with tickformat %H~%M~%S.%2f would display 09~15~23.46
- Determines how we handle tick labels that would overflow either the graph div or the domain of the axis. The default value for inside tick labels is hide past domain. In other cases the default is hide past div.
- Determines where tick labels are drawn relative to the ticks. Left and right options are used when
orientationis h, top and bottom whenorientationis v. - Sets the spacing between tick labels as compared to the spacing between ticks. A value of 1 (default) means each tick gets a label. A value of 2 means shows every 2nd label. A larger value n means only every nth tick is labeled.
tick0determines which labels are shown. Not implemented for axes withtypelog or multicategory, or whentickmodeis array. - Sets the tick length (in px).
- Sets the tick mode for this axis. If auto, the number of ticks is set via
nticks. If linear, the placement of the ticks is determined by a starting positiontick0and a tick stepdtick(linear is the default value iftick0anddtickare provided). If array, the placement of the ticks is set viatickvalsand the tick text isticktext. (array is the default value iftickvalsis provided). - Sets a tick label prefix.
- Determines whether ticks are drawn or not. If , this axis' ticks are not drawn. If outside (inside), this axis' are drawn outside (inside) the axis lines.
- Sets a tick label suffix.
- Sets the text displayed at the ticks position via
tickvals. Only has an effect iftickmodeis set to array. Used withtickvals. - Sets the source reference on Chart Studio Cloud for
ticktext. - Sets the values at which ticks on this axis appear. Only has an effect if
tickmodeis set to array. Used withticktext. - Sets the source reference on Chart Studio Cloud for
tickvals. - Sets the tick width (in px).
- HTML font family - the typeface that will be applied by the web browser. The web browser can only apply a font if it is available on the system where it runs. Provide multiple font families, separated by commas, to indicate the order in which to apply fonts if they aren't available.
- Sets the kind of decoration line(s) with text, such as an under, over or through as well as combinations e.g. under+over, etc.
- Sets the shape and color of the shadow behind text. auto places minimal shadow and applies contrast text font color. See https://developer.mozilla.org/en-US/docs/Web/CSS/text-shadow for additional options.
- Sets whether a font should be styled with a normal or italic face from its family.
- Sets capitalization of text. It can be used to make text appear in all-uppercase or all-lowercase, or with each word capitalized.
- Sets the variant of the font.
- Sets the weight (or boldness) of the font.
- Determines the location of color bar's title with respect to the color bar. Defaults to top when
orientationif v and defaults to right whenorientationif h. - Sets the title of the color bar.
- Sets the x position with respect to
xrefof the color bar (in plot fraction). Whenxrefis paper, defaults to 1.02 whenorientationis v and 0.5 whenorientationis h. Whenxrefis container, defaults to 1 whenorientationis v and 0.5 whenorientationis h. Must be between 0 and 1 ifxrefis container and between -2 and 3 ifxrefis paper. - Sets this color bar's horizontal position anchor. This anchor binds the
xposition to the left, center or right of the color bar. Defaults to left whenorientationis v and center whenorientationis h. - Sets the amount of padding (in px) along the x direction.
- Sets the container
xrefers to. container spans the entirewidthof the plot. paper refers to the width of the plotting area only. - Sets the y position with respect to
yrefof the color bar (in plot fraction). Whenyrefis paper, defaults to 0.5 whenorientationis v and 1.02 whenorientationis h. Whenyrefis container, defaults to 0.5 whenorientationis v and 1 whenorientationis h. Must be between 0 and 1 ifyrefis container and between -2 and 3 ifyrefis paper. - Sets this color bar's vertical position anchor This anchor binds the
yposition to the top, middle or bottom of the color bar. Defaults to middle whenorientationis v and bottom whenorientationis h. - Sets the amount of padding (in px) along the y direction.
- Sets the container
yrefers to. container spans the entireheightof the plot. paper refers to the height of the plotting area only. - Sets the color of each sector of this trace. If not specified, the default trace color set is used to pick the sector colors.
- Sets the colorscale. Has an effect only if colors is set to a numerical array. The colorscale must be an array containing arrays mapping a normalized value to an rgb, rgba, hex, hsl, hsv, or named color string. At minimum, a mapping for the lowest (0) and highest (1) values are required. For example,
[[0, 'rgb(0,0,255)'], [1, 'rgb(255,0,0)']]. To control the bounds of the colorscale in color space, usemarker.cminandmarker.cmax. Alternatively,colorscalemay be a palette name string of the following list: Blackbody,Bluered,Blues,Cividis,Earth,Electric,Greens,Greys,Hot,Jet,Picnic,Portland,Rainbow,RdBu,Reds,Viridis,YlGnBu,YlOrRd. - Sets the source reference on Chart Studio Cloud for
colors. - Sets the color of the line enclosing each sector. Defaults to the
paper_bgcolorvalue. - Sets the source reference on Chart Studio Cloud for
color. - Sets the width (in px) of the line enclosing each sector.
- Sets the source reference on Chart Studio Cloud for
width. - When there is no colorscale sets the color of background pattern fill. Defaults to a
marker.colorbackground whenfillmodeis overlay. Otherwise, defaults to a transparent background. - Sets the source reference on Chart Studio Cloud for
bgcolor. - When there is no colorscale sets the color of foreground pattern fill. Defaults to a
marker.colorbackground whenfillmodeis replace. Otherwise, defaults to dark grey or white to increase contrast with thebgcolor. - Sets the source reference on Chart Studio Cloud for
fgcolor. - Sets the opacity of the foreground pattern fill. Defaults to a 0.5 when
fillmodeis overlay. Otherwise, defaults to 1. - Determines whether
marker.colorshould be used as a default tobgcoloror afgcolor. - Sets the shape of the pattern fill. By default, no pattern is used for filling the area.
- Sets the source reference on Chart Studio Cloud for
shape. - Sets the size of unit squares of the pattern fill in pixels, which corresponds to the interval of repetition of the pattern.
- Sets the source reference on Chart Studio Cloud for
size. - Sets the solidity of the pattern fill. Solidity is roughly the fraction of the area filled by the pattern. Solidity of 0 shows only the background color without pattern and solidty of 1 shows only the foreground color without pattern.
- Sets the source reference on Chart Studio Cloud for
solidity. - Reverses the color mapping if true. Has an effect only if colors is set to a numerical array. If true,
marker.cminwill correspond to the last color in the array andmarker.cmaxwill correspond to the first color. - Determines whether or not a colorbar is displayed for this trace. Has an effect only if colors is set to a numerical array.
- Sets the number of rendered sectors from any given
level. Setmaxdepthto -1 to render all the levels in the hierarchy. - Sets the source reference on Chart Studio Cloud for
meta. - Sets the trace name. The trace name appears as the legend item and on hover.
- Sets the opacity of the trace.
- Sets the source reference on Chart Studio Cloud for
color. - HTML font family - the typeface that will be applied by the web browser. The web browser can only apply a font if it is available on the system where it runs. Provide multiple font families, separated by commas, to indicate the order in which to apply fonts if they aren't available.
- Sets the source reference on Chart Studio Cloud for
family. - Sets the kind of decoration line(s) with text, such as an under, over or through as well as combinations e.g. under+over, etc.
- Sets the source reference on Chart Studio Cloud for
lineposition. - Sets the shape and color of the shadow behind text. auto places minimal shadow and applies contrast text font color. See https://developer.mozilla.org/en-US/docs/Web/CSS/text-shadow for additional options.
- Sets the source reference on Chart Studio Cloud for
shadow. - Sets the source reference on Chart Studio Cloud for
size. - Sets whether a font should be styled with a normal or italic face from its family.
- Sets the source reference on Chart Studio Cloud for
style. - Sets capitalization of text. It can be used to make text appear in all-uppercase or all-lowercase, or with each word capitalized.
- Sets the source reference on Chart Studio Cloud for
textcase. - Sets the variant of the font.
- Sets the source reference on Chart Studio Cloud for
variant. - Sets the weight (or boldness) of the font.
- Sets the source reference on Chart Studio Cloud for
weight. - Sets the parent sectors for each of the sectors. Empty string items '' are understood to reference the root node in the hierarchy. If
idsis filled,parentsitems are understood to be "ids" themselves. Whenidsis not set, plotly attempts to find matching items inlabels, but beware they must be unique. - Sets the source reference on Chart Studio Cloud for
parents. - Determines which shape is used for edges between
barpathlabels. - Determines on which side of the the treemap the
pathbarshould be presented. - Sets the source reference on Chart Studio Cloud for
color. - HTML font family - the typeface that will be applied by the web browser. The web browser can only apply a font if it is available on the system where it runs. Provide multiple font families, separated by commas, to indicate the order in which to apply fonts if they aren't available.
- Sets the source reference on Chart Studio Cloud for
family. - Sets the kind of decoration line(s) with text, such as an under, over or through as well as combinations e.g. under+over, etc.
- Sets the source reference on Chart Studio Cloud for
lineposition. - Sets the shape and color of the shadow behind text. auto places minimal shadow and applies contrast text font color. See https://developer.mozilla.org/en-US/docs/Web/CSS/text-shadow for additional options.
- Sets the source reference on Chart Studio Cloud for
shadow. - Sets the source reference on Chart Studio Cloud for
size. - Sets whether a font should be styled with a normal or italic face from its family.
- Sets the source reference on Chart Studio Cloud for
style. - Sets capitalization of text. It can be used to make text appear in all-uppercase or all-lowercase, or with each word capitalized.
- Sets the source reference on Chart Studio Cloud for
textcase. - Sets the variant of the font.
- Sets the source reference on Chart Studio Cloud for
variant. - Sets the weight (or boldness) of the font.
- Sets the source reference on Chart Studio Cloud for
weight. - Sets the thickness of
pathbar(in px). If not specified thepathbar.textfont.sizeis used with 3 pixles extra padding on each side. - Determines if the path bar is drawn i.e. outside the trace
domainand with one pixel gap. - sets the color of the root node for a sunburst/treemap/icicle trace. this has no effect when a colorscale is used to set the markers.
- Determines whether or not the sectors are reordered from largest to smallest.
- Sets the maximum number of points to keep on the plots from an incoming stream. If
maxpointsis set to 50, only the newest 50 points will be displayed on the plot. - The stream id number links a data trace on a plot with a stream. See https://chart-studio.plotly.com/settings for more details.
- Sets text elements associated with each sector. If trace
textinfocontains a text flag, these elements will be seen on the chart. If tracehoverinfocontains a text flag and hovertext is not set, these elements will be seen in the hover labels. - Sets the source reference on Chart Studio Cloud for
color. - HTML font family - the typeface that will be applied by the web browser. The web browser can only apply a font if it is available on the system where it runs. Provide multiple font families, separated by commas, to indicate the order in which to apply fonts if they aren't available.
- Sets the source reference on Chart Studio Cloud for
family. - Sets the kind of decoration line(s) with text, such as an under, over or through as well as combinations e.g. under+over, etc.
- Sets the source reference on Chart Studio Cloud for
lineposition. - Sets the shape and color of the shadow behind text. auto places minimal shadow and applies contrast text font color. See https://developer.mozilla.org/en-US/docs/Web/CSS/text-shadow for additional options.
- Sets the source reference on Chart Studio Cloud for
shadow. - Sets the source reference on Chart Studio Cloud for
size. - Sets whether a font should be styled with a normal or italic face from its family.
- Sets the source reference on Chart Studio Cloud for
style. - Sets capitalization of text. It can be used to make text appear in all-uppercase or all-lowercase, or with each word capitalized.
- Sets the source reference on Chart Studio Cloud for
textcase. - Sets the variant of the font.
- Sets the source reference on Chart Studio Cloud for
variant. - Sets the weight (or boldness) of the font.
- Sets the source reference on Chart Studio Cloud for
weight. - Determines which trace information appear on the graph.
- Sets the positions of the
textelements. - Sets the source reference on Chart Studio Cloud for
text. - Template string used for rendering the information text that appear on points. Note that this will override
textinfo. Variables are inserted using %{variable}, for example "y: %{y}". Numbers are formatted using d3-format's syntax %{variable:d3-format}, for example "Price: %{y:$.2f}". https://github.com/d3/d3-format/tree/v1.4.5#d3-format for details on the formatting syntax. Dates are formatted using d3-time-format's syntax %{variable|d3-time-format}, for example "Day: %{2019-01-01|%A}". https://github.com/d3/d3-time-format/tree/v2.2.3#locale_format for details on the date formatting syntax. Every attributes that can be specified per-point (the ones that arearrayOk: true) are available. Finally, the template string has access to variablescurrentPath,root,entry,percentRoot,percentEntry,percentParent,labelandvalue. - Sets the source reference on Chart Studio Cloud for
texttemplate. - Determines if the positions obtained from solver are flipped on each axis.
- When set in conjunction with
tiling.flip, determines on which side the root nodes are drawn in the chart. Iftiling.orientationis v andtiling.flipis , the root nodes appear at the top. Iftiling.orientationis v andtiling.flipis y, the root nodes appear at the bottom. Iftiling.orientationis h andtiling.flipis , the root nodes appear at the left. Iftiling.orientationis h andtiling.flipis x, the root nodes appear at the right. - Sets the inner padding (in px).
- Assign an id to this trace, Use this to provide object constancy between traces during animations and transitions.
- Sets the values associated with each of the sectors. Use with
branchvaluesto determine how the values are summed. - Sets the source reference on Chart Studio Cloud for
values. - Determines whether or not this trace is visible. If legendonly, the trace is not drawn, but can appear as a legend item (provided that the legend itself is visible).