Indicator
Overview
The indicator trace type is used to create key performance indicator (KPI) visualizations, allowing you to display single or aggregated values in a gauge or numeric format. Indicators are great for showing metrics like progress, performance, or key values at a glance.
You can customize the gauge, delta values, colors, and text annotations to represent your data effectively. Indicator plots are widely used in dashboards and reporting.
Common Uses
- KPI Dashboards: Displaying key metrics, progress, or performance indicators.
- Gauges: Visualizing values as a gauge to track goals or targets.
- Highlighting Change: Showing the difference between two points in time.
Check out the Attributes for the full set of configuration options
Examples
Common Configurations
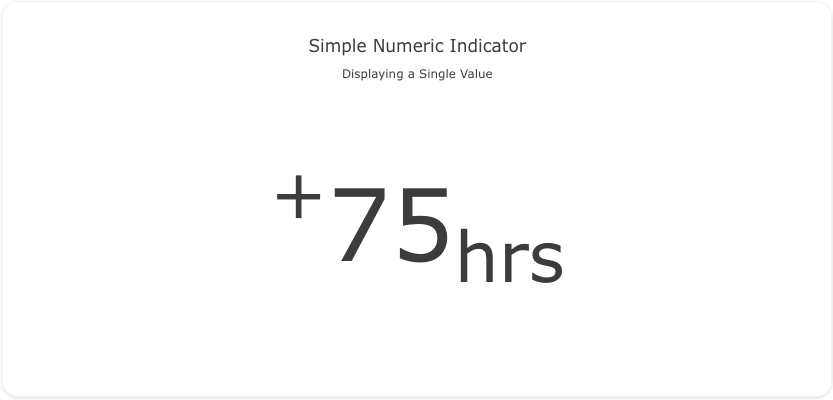
Here's a simple indicator plot displaying a single numeric value:
You can copy this code below to create this chart in your project:
models:
  - name: indicator-data
    args:
      - echo
      - |
        value
        75
traces:
  - name: Simple Numeric Indicator
    model: ${ref(indicator-data)}
    columns:
      val: value
      sign: case when value > 0 then '<sup>+</sup>' else '<sup>-</sup>' end
    props:
      type: indicator
      mode: "number"
      value: column(val)[0]
      number:
        suffix: '<sub>hrs</sub>'
        prefix: column(sign)[0]
        font:
          size: 100
charts:
  - name: Simple Numeric Indicator Chart
    traces:
      - ${ref(Simple Numeric Indicator)}
    layout:
      title:
        text: Simple Numeric Indicator<br><sub>Displaying a Single Value</sub>
    margin:
      l: 0
      r: 0
      b: 50
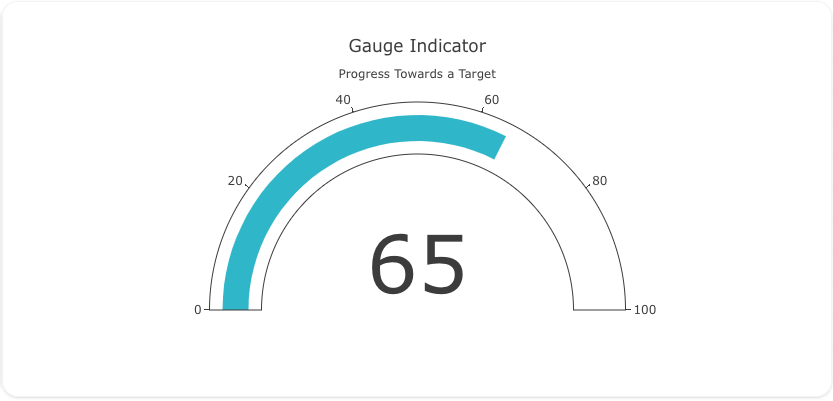
This example shows a gauge indicator to represent a value and its progress toward a goal:
Here's the code:
models:
  - name: indicator-data-gauge
    args:
      - echo
      - |
        value
        65
traces:
  - name: Gauge Indicator
    model: ${ref(indicator-data-gauge)}
    columns:
      val: value
    props:
      type: indicator
      mode: "gauge+number"
      value: column(val)[0]
      gauge:
        axis:
          range: [0, 100]
        bar:
          color: "#17becf"
charts:
  - name: Gauge Indicator Chart
    traces:
      - ${ref(Gauge Indicator)}
    layout:
      title:
        text: Gauge Indicator<br><sub>Progress Towards a Target</sub>
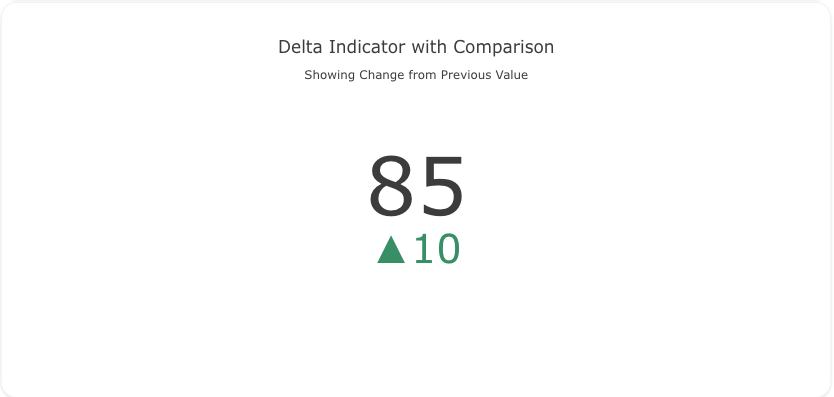
This example demonstrates an indicator plot with delta values, comparing the current value to a previous value:
Here's the code:
models:
  - name: indicator-data-delta
    args:
      - echo
      - |
        sort,value
        3,85
        2,75
        1,65
        0,55
traces:
  - name: Delta Indicator with Comparison
    model: ${ref(indicator-data-delta)}
    columns:
      val: value
    props:
      type: indicator
      mode: "number+delta"
      value: column(val)[0]
      delta:
        reference: column(val)[1]
    order_by:
      - ?{sort desc}
charts:
  - name: Delta Indicator with Comparison Chart
    traces:
      - ${ref(Delta Indicator with Comparison)}
    layout:
      title:
        text: Delta Indicator with Comparison<br><sub>Showing Change from Previous Value</sub>
A schema to validate plotly trace properties
Attributes
These attributes apply to traces where trace.props.type is set to indicator. You would configure these attributes on the trace with the trace.props object.
align: 'any' #(1)!
customdata: 'array' #(2)!
customdatasrc: 'string' #(3)!
delta:
  decreasing:
    color: 'any' #(4)!
    symbol: 'string' #(5)!
  font:
    color: any
    family: 'string' #(6)!
    lineposition: 'string' #(7)!
    shadow: 'string' #(8)!
    size: number
    style: 'any' #(9)!
    textcase: 'any' #(10)!
    variant: 'any' #(11)!
    weight: 'integer' #(12)!
  increasing:
    color: 'any' #(13)!
    symbol: 'string' #(14)!
  position: 'any' #(15)!
  prefix: 'string' #(16)!
  reference: 'number' #(17)!
  relative: 'boolean' #(18)!
  suffix: 'string' #(19)!
  valueformat: 'string' #(20)!
domain:
  column: 'integer' #(21)!
  row: 'integer' #(22)!
  x: 'array' #(23)!
  y: 'array' #(24)!
gauge:
  axis:
    exponentformat: 'any' #(25)!
    minexponent: 'number' #(26)!
    nticks: 'integer' #(27)!
    range: 'array' #(28)!
    separatethousands: 'boolean' #(29)!
    showexponent: 'any' #(30)!
    showticklabels: 'boolean' #(31)!
    showtickprefix: 'any' #(32)!
    showticksuffix: 'any' #(33)!
    tickangle: 'number' #(34)!
    tickcolor: 'any' #(35)!
    tickfont:
      color: any
      family: 'string' #(36)!
      lineposition: 'string' #(37)!
      shadow: 'string' #(38)!
      size: number
      style: 'any' #(39)!
      textcase: 'any' #(40)!
      variant: 'any' #(41)!
      weight: 'integer' #(42)!
    tickformat: 'string' #(43)!
    tickformatstops: array
    ticklabelstep: 'integer' #(44)!
    ticklen: 'number' #(45)!
    tickmode: 'any' #(46)!
    tickprefix: 'string' #(47)!
    ticks: 'any' #(48)!
    ticksuffix: 'string' #(49)!
    ticktext: 'array' #(50)!
    ticktextsrc: 'string' #(51)!
    tickvals: 'array' #(52)!
    tickvalssrc: 'string' #(53)!
    tickwidth: 'number' #(54)!
    visible: 'boolean' #(55)!
  bar:
    color: 'any' #(56)!
    line:
      color: 'any' #(57)!
      width: 'number' #(58)!
    thickness: 'number' #(59)!
  bgcolor: 'any' #(60)!
  bordercolor: 'any' #(61)!
  borderwidth: 'number' #(62)!
  shape: 'any' #(63)!
  steps: array
  threshold:
    line:
      color: 'any' #(64)!
      width: 'number' #(65)!
    thickness: 'number' #(66)!
    value: 'number' #(67)!
ids: 'array' #(68)!
idssrc: 'string' #(69)!
legend: 'string' #(70)!
legendgrouptitle:
  font:
    color: any
    family: 'string' #(71)!
    lineposition: 'string' #(72)!
    shadow: 'string' #(73)!
    size: number
    style: 'any' #(74)!
    textcase: 'any' #(75)!
    variant: 'any' #(76)!
    weight: 'integer' #(77)!
  text: 'string' #(78)!
legendrank: 'number' #(79)!
legendwidth: 'number' #(80)!
metasrc: 'string' #(81)!
mode: 'string' #(82)!
name: 'string' #(83)!
number:
  font:
    color: any
    family: 'string' #(84)!
    lineposition: 'string' #(85)!
    shadow: 'string' #(86)!
    size: number
    style: 'any' #(87)!
    textcase: 'any' #(88)!
    variant: 'any' #(89)!
    weight: 'integer' #(90)!
  prefix: 'string' #(91)!
  suffix: 'string' #(92)!
  valueformat: 'string' #(93)!
stream:
  maxpoints: 'number' #(94)!
  token: 'string' #(95)!
title:
  align: 'any' #(96)!
  font:
    color: any
    family: 'string' #(97)!
    lineposition: 'string' #(98)!
    shadow: 'string' #(99)!
    size: number
    style: 'any' #(100)!
    textcase: 'any' #(101)!
    variant: 'any' #(102)!
    weight: 'integer' #(103)!
  text: 'string' #(104)!
type: indicator
uid: 'string' #(105)!
value: 'number' #(106)!
visible: 'any' #(107)!
- Sets the horizontal alignment of the
textwithin the box. Note that this attribute has no effect if an angular gauge is displayed: in this case, it is always centered - Assigns extra data each datum. This may be useful when listening to hover, click and selection events. Note that, scatter traces also appends customdata items in the markers DOM elements
- Sets the source reference on Chart Studio Cloud for
customdata. - Sets the color for increasing value.
- Sets the symbol to display for increasing value
- HTML font family - the typeface that will be applied by the web browser. The web browser can only apply a font if it is available on the system where it runs. Provide multiple font families, separated by commas, to indicate the order in which to apply fonts if they aren't available.
- Sets the kind of decoration line(s) with text, such as an under, over or through as well as combinations e.g. under+over, etc.
- Sets the shape and color of the shadow behind text. auto places minimal shadow and applies contrast text font color. See https://developer.mozilla.org/en-US/docs/Web/CSS/text-shadow for additional options.
- Sets whether a font should be styled with a normal or italic face from its family.
- Sets capitalization of text. It can be used to make text appear in all-uppercase or all-lowercase, or with each word capitalized.
- Sets the variant of the font.
- Sets the weight (or boldness) of the font.
- Sets the color for increasing value.
- Sets the symbol to display for increasing value
- Sets the position of delta with respect to the number.
- Sets a prefix appearing before the delta.
- Sets the reference value to compute the delta. By default, it is set to the current value.
- Show relative change
- Sets a suffix appearing next to the delta.
- Sets the value formatting rule using d3 formatting mini-languages which are very similar to those in Python. For numbers, see: https://github.com/d3/d3-format/tree/v1.4.5#d3-format.
- If there is a layout grid, use the domain for this column in the grid for this indicator trace .
- If there is a layout grid, use the domain for this row in the grid for this indicator trace .
- Sets the horizontal domain of this indicator trace (in plot fraction).
- Sets the vertical domain of this indicator trace (in plot fraction).
- Determines a formatting rule for the tick exponents. For example, consider the number 1,000,000,000. If none, it appears as 1,000,000,000. If e, 1e+9. If E, 1E+9. If power, 1x10^9 (with 9 in a super script). If SI, 1G. If B, 1B.
- Hide SI prefix for 10^n if |n| is below this number. This only has an effect when
tickformatis SI or B. - Specifies the maximum number of ticks for the particular axis. The actual number of ticks will be chosen automatically to be less than or equal to
nticks. Has an effect only iftickmodeis set to auto. - Sets the range of this axis.
- If "true", even 4-digit integers are separated
- If all, all exponents are shown besides their significands. If first, only the exponent of the first tick is shown. If last, only the exponent of the last tick is shown. If none, no exponents appear.
- Determines whether or not the tick labels are drawn.
- If all, all tick labels are displayed with a prefix. If first, only the first tick is displayed with a prefix. If last, only the last tick is displayed with a suffix. If none, tick prefixes are hidden.
- Same as
showtickprefixbut for tick suffixes. - Sets the angle of the tick labels with respect to the horizontal. For example, a
tickangleof -90 draws the tick labels vertically. - Sets the tick color.
- HTML font family - the typeface that will be applied by the web browser. The web browser can only apply a font if it is available on the system where it runs. Provide multiple font families, separated by commas, to indicate the order in which to apply fonts if they aren't available.
- Sets the kind of decoration line(s) with text, such as an under, over or through as well as combinations e.g. under+over, etc.
- Sets the shape and color of the shadow behind text. auto places minimal shadow and applies contrast text font color. See https://developer.mozilla.org/en-US/docs/Web/CSS/text-shadow for additional options.
- Sets whether a font should be styled with a normal or italic face from its family.
- Sets capitalization of text. It can be used to make text appear in all-uppercase or all-lowercase, or with each word capitalized.
- Sets the variant of the font.
- Sets the weight (or boldness) of the font.
- Sets the tick label formatting rule using d3 formatting mini-languages which are very similar to those in Python. For numbers, see: https://github.com/d3/d3-format/tree/v1.4.5#d3-format. And for dates see: https://github.com/d3/d3-time-format/tree/v2.2.3#locale_format. We add two items to d3's date formatter: %h for half of the year as a decimal number as well as %{n}f for fractional seconds with n digits. For example, 2016-10-13 09:15:23.456 with tickformat %H~%M~%S.%2f would display 09~15~23.46
- Sets the spacing between tick labels as compared to the spacing between ticks. A value of 1 (default) means each tick gets a label. A value of 2 means shows every 2nd label. A larger value n means only every nth tick is labeled.
tick0determines which labels are shown. Not implemented for axes withtypelog or multicategory, or whentickmodeis array. - Sets the tick length (in px).
- Sets the tick mode for this axis. If auto, the number of ticks is set via
nticks. If linear, the placement of the ticks is determined by a starting positiontick0and a tick stepdtick(linear is the default value iftick0anddtickare provided). If array, the placement of the ticks is set viatickvalsand the tick text isticktext. (array is the default value iftickvalsis provided). - Sets a tick label prefix.
- Determines whether ticks are drawn or not. If , this axis' ticks are not drawn. If outside (inside), this axis' are drawn outside (inside) the axis lines.
- Sets a tick label suffix.
- Sets the text displayed at the ticks position via
tickvals. Only has an effect iftickmodeis set to array. Used withtickvals. - Sets the source reference on Chart Studio Cloud for
ticktext. - Sets the values at which ticks on this axis appear. Only has an effect if
tickmodeis set to array. Used withticktext. - Sets the source reference on Chart Studio Cloud for
tickvals. - Sets the tick width (in px).
- A single toggle to hide the axis while preserving interaction like dragging. Default is true when a cheater plot is present on the axis, otherwise false
- Sets the background color of the arc.
- Sets the color of the line enclosing each sector.
- Sets the width (in px) of the line enclosing each sector.
- Sets the thickness of the bar as a fraction of the total thickness of the gauge.
- Sets the gauge background color.
- Sets the color of the border enclosing the gauge.
- Sets the width (in px) of the border enclosing the gauge.
- Set the shape of the gauge
- Sets the color of the threshold line.
- Sets the width (in px) of the threshold line.
- Sets the thickness of the threshold line as a fraction of the thickness of the gauge.
- Sets a threshold value drawn as a line.
- Assigns id labels to each datum. These ids for object constancy of data points during animation. Should be an array of strings, not numbers or any other type.
- Sets the source reference on Chart Studio Cloud for
ids. - Sets the reference to a legend to show this trace in. References to these legends are legend, legend2, legend3, etc. Settings for these legends are set in the layout, under
layout.legend,layout.legend2, etc. - HTML font family - the typeface that will be applied by the web browser. The web browser can only apply a font if it is available on the system where it runs. Provide multiple font families, separated by commas, to indicate the order in which to apply fonts if they aren't available.
- Sets the kind of decoration line(s) with text, such as an under, over or through as well as combinations e.g. under+over, etc.
- Sets the shape and color of the shadow behind text. auto places minimal shadow and applies contrast text font color. See https://developer.mozilla.org/en-US/docs/Web/CSS/text-shadow for additional options.
- Sets whether a font should be styled with a normal or italic face from its family.
- Sets capitalization of text. It can be used to make text appear in all-uppercase or all-lowercase, or with each word capitalized.
- Sets the variant of the font.
- Sets the weight (or boldness) of the font.
- Sets the title of the legend group.
- Sets the legend rank for this trace. Items and groups with smaller ranks are presented on top/left side while with reversed
legend.traceorderthey are on bottom/right side. The default legendrank is 1000, so that you can use ranks less than 1000 to place certain items before all unranked items, and ranks greater than 1000 to go after all unranked items. When having unranked or equal rank items shapes would be displayed after traces i.e. according to their order in data and layout. - Sets the width (in px or fraction) of the legend for this trace.
- Sets the source reference on Chart Studio Cloud for
meta. - Determines how the value is displayed on the graph.
numberdisplays the value numerically in text.deltadisplays the difference to a reference value in text. Finally,gaugedisplays the value graphically on an axis. - Sets the trace name. The trace name appears as the legend item and on hover.
- HTML font family - the typeface that will be applied by the web browser. The web browser can only apply a font if it is available on the system where it runs. Provide multiple font families, separated by commas, to indicate the order in which to apply fonts if they aren't available.
- Sets the kind of decoration line(s) with text, such as an under, over or through as well as combinations e.g. under+over, etc.
- Sets the shape and color of the shadow behind text. auto places minimal shadow and applies contrast text font color. See https://developer.mozilla.org/en-US/docs/Web/CSS/text-shadow for additional options.
- Sets whether a font should be styled with a normal or italic face from its family.
- Sets capitalization of text. It can be used to make text appear in all-uppercase or all-lowercase, or with each word capitalized.
- Sets the variant of the font.
- Sets the weight (or boldness) of the font.
- Sets a prefix appearing before the number.
- Sets a suffix appearing next to the number.
- Sets the value formatting rule using d3 formatting mini-languages which are very similar to those in Python. For numbers, see: https://github.com/d3/d3-format/tree/v1.4.5#d3-format.
- Sets the maximum number of points to keep on the plots from an incoming stream. If
maxpointsis set to 50, only the newest 50 points will be displayed on the plot. - The stream id number links a data trace on a plot with a stream. See https://chart-studio.plotly.com/settings for more details.
- Sets the horizontal alignment of the title. It defaults to
centerexcept for bullet charts for which it defaults to right. - HTML font family - the typeface that will be applied by the web browser. The web browser can only apply a font if it is available on the system where it runs. Provide multiple font families, separated by commas, to indicate the order in which to apply fonts if they aren't available.
- Sets the kind of decoration line(s) with text, such as an under, over or through as well as combinations e.g. under+over, etc.
- Sets the shape and color of the shadow behind text. auto places minimal shadow and applies contrast text font color. See https://developer.mozilla.org/en-US/docs/Web/CSS/text-shadow for additional options.
- Sets whether a font should be styled with a normal or italic face from its family.
- Sets capitalization of text. It can be used to make text appear in all-uppercase or all-lowercase, or with each word capitalized.
- Sets the variant of the font.
- Sets the weight (or boldness) of the font.
- Sets the title of this indicator.
- Assign an id to this trace, Use this to provide object constancy between traces during animations and transitions.
- Sets the number to be displayed.
- Determines whether or not this trace is visible. If legendonly, the trace is not drawn, but can appear as a legend item (provided that the legend itself is visible).