Violin
Overview
The violin trace type is used to create violin plots, which visualize the distribution of numerical data. Violin plots combine aspects of box plots and density plots to show the distribution of the data, including its probability density. They are ideal for comparing distributions between different categories.
You can customize the orientation, kernel density estimation, and colors to represent the distribution data effectively.
Common Uses
- Distribution Analysis: Visualizing the distribution of a dataset, similar to box plots but with additional information about the density of data.
- Comparing Categories: Comparing the distribution of numerical data across different categories.
- Outlier Detection: Identifying outliers and the shape of the data distribution.
Check out the Attributes for the full set of configuration options
Examples
Common Configurations
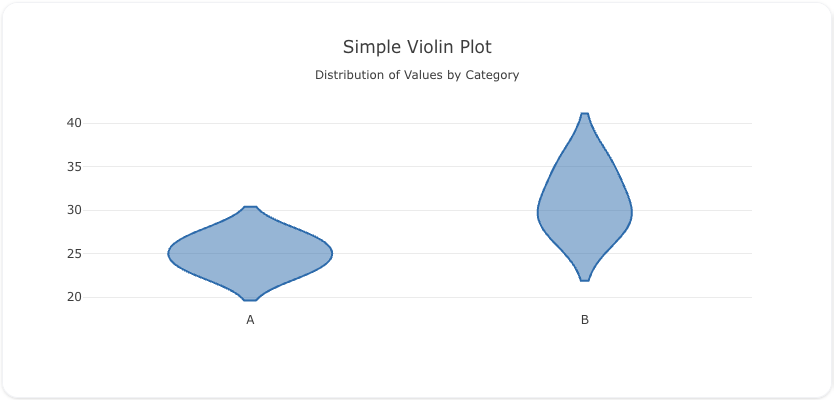
Here's a simple violin plot showing the distribution of values for two categories:
You can copy this code below to create this chart in your project:
models:
  - name: violin-data
    args:
      - echo
      - |
        category,value
        A,23
        A,25
        A,27
        B,30
        B,35
        B,28
traces:
  - name: Simple Violin Plot
    model: ${ref(violin-data)}
    props:
      type: violin
      x: ?{category}
      y: ?{value}
charts:
  - name: Simple Violin Chart
    traces:
      - ${ref(Simple Violin Plot)}
    layout:
      title:
        text: Simple Violin Plot<br><sub>Distribution of Values by Category</sub>
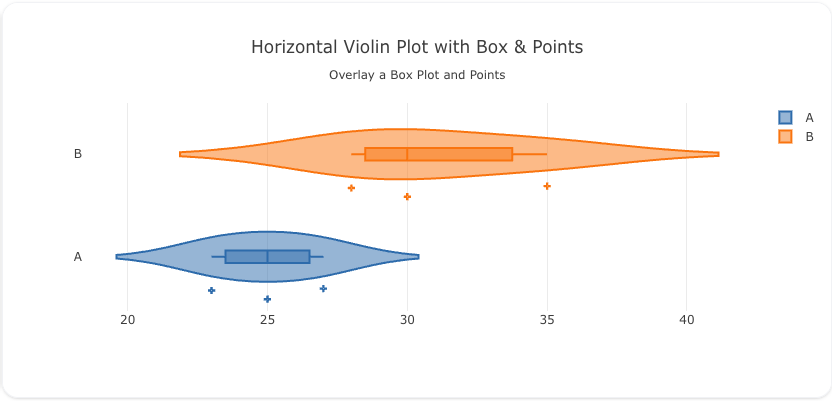
This example demonstrates a violin plot with a box plot overlay and individual data points:
Here's the code:
models:
  - name: violin-data-box
    args:
      - echo
      - |
        category,value
        A,23
        A,25
        A,27
        B,30
        B,35
        B,28
traces:
  - name: Violin Plot with Box
    model: ${ref(violin-data-box)}
    cohort_on: category
    props:
      type: violin
      y: ?{category}
      x: ?{value}
      orientation: h
      box:
        visible: true
      points: "all"
      marker:
        symbol: "cross-dot"
charts:
  - name: Violin Chart with Box
    traces:
      - ${ref(Violin Plot with Box)}
    layout:
      title:
        text: Violin Plot with Box Overlay<br><sub>Distribution with Box Plot and Data Points</sub>
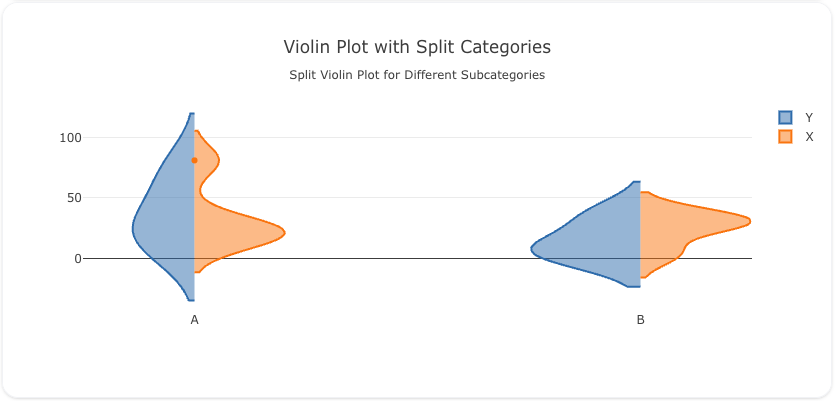
Here's a violin plot where the data is split by two categories, providing a side-by-side comparison of distributions:
Here's the code:
models:
  - name: violin-data-split
    args:
      - echo
      - |
        category,sub_category,value
        A,X,23
        A,Y,25
        A,Y,70
        A,Y,15
        A,X,27
        A,X,13
        A,X,21
        A,X,81
        B,X,30
        B,X,35
        B,X,4
        B,Y,35
        B,Y,6
        B,Y,5
        B,X,28
traces:
  - name: Violin Plot Category X
    model: ${ref(violin-data-split)}
    cohort_on: sub_category
    props:
      type: violin
      side: positive
      x: ?{category}
      y: ?{value}
    filters:
      - ?{ sub_category = 'X'}
  - name: Violin Plot Category Y
    model: ${ref(violin-data-split)}
    cohort_on: sub_category
    props:
      type: violin
      side: negative
      x: ?{category}
      y: ?{value}
    filters:
      - ?{ sub_category = 'Y'}
charts:
  - name: Violin Chart with Split Categories
    traces:
      - ${ref(Violin Plot Category Y)}
      - ${ref(Violin Plot Category X)}
    layout:
      title:
        text: Violin Plot with Split Categories<br><sub>Side-by-Side Comparison of Distributions</sub>
A schema to validate plotly trace properties
Attributes
These attributes apply to traces where trace.props.type is set to violin. You would configure these attributes on the trace with the trace.props object.
alignmentgroup: 'string' #(1)!
bandwidth: 'number' #(2)!
box:
  fillcolor: 'any' #(3)!
  line:
    color: 'any' #(4)!
    width: 'number' #(5)!
  visible: 'boolean' #(6)!
  width: 'number' #(7)!
customdata: 'array' #(8)!
customdatasrc: 'string' #(9)!
fillcolor: 'any' #(10)!
hoverinfo: 'array' #(11)!
hoverinfosrc: 'string' #(12)!
hoverlabel:
  align: 'array' #(13)!
  alignsrc: 'string' #(14)!
  bgcolor: 'color | array' #(15)!
  bgcolorsrc: 'string' #(16)!
  bordercolor: 'color | array' #(17)!
  bordercolorsrc: 'string' #(18)!
  font:
    color: color | array
    colorsrc: 'string' #(19)!
    family: 'string | array' #(20)!
    familysrc: 'string' #(21)!
    lineposition: 'array' #(22)!
    linepositionsrc: 'string' #(23)!
    shadow: 'string | array' #(24)!
    shadowsrc: 'string' #(25)!
    size: number | array
    sizesrc: 'string' #(26)!
    style: 'array' #(27)!
    stylesrc: 'string' #(28)!
    textcase: 'array' #(29)!
    textcasesrc: 'string' #(30)!
    variant: 'array' #(31)!
    variantsrc: 'string' #(32)!
    weight: 'integer | array' #(33)!
    weightsrc: 'string' #(34)!
  namelength: 'integer | array' #(35)!
  namelengthsrc: 'string' #(36)!
hoveron: 'string' #(37)!
hovertemplate: 'string | array' #(38)!
hovertemplatesrc: 'string' #(39)!
hovertext: 'string | array' #(40)!
hovertextsrc: 'string' #(41)!
ids: 'array' #(42)!
idssrc: 'string' #(43)!
jitter: 'number' #(44)!
legend: 'string' #(45)!
legendgroup: 'string' #(46)!
legendgrouptitle:
  font:
    color: any
    family: 'string' #(47)!
    lineposition: 'string' #(48)!
    shadow: 'string' #(49)!
    size: number
    style: 'any' #(50)!
    textcase: 'any' #(51)!
    variant: 'any' #(52)!
    weight: 'integer' #(53)!
  text: 'string' #(54)!
legendrank: 'number' #(55)!
legendwidth: 'number' #(56)!
line:
  color: 'any' #(57)!
  width: 'number' #(58)!
marker:
  angle: 'number' #(59)!
  color: 'any' #(60)!
  line:
    color: 'any' #(61)!
    outliercolor: 'any' #(62)!
    outlierwidth: 'number' #(63)!
    width: 'number' #(64)!
  opacity: 'number' #(65)!
  outliercolor: 'any' #(66)!
  size: 'number' #(67)!
  symbol: 'any' #(68)!
meanline:
  color: 'any' #(69)!
  visible: 'boolean' #(70)!
  width: 'number' #(71)!
metasrc: 'string' #(72)!
name: 'string' #(73)!
offsetgroup: 'string' #(74)!
opacity: 'number' #(75)!
orientation: 'any' #(76)!
pointpos: 'number' #(77)!
points: 'any' #(78)!
quartilemethod: 'any' #(79)!
scalegroup: 'string' #(80)!
scalemode: 'any' #(81)!
selected:
  marker:
    color: 'any' #(82)!
    opacity: 'number' #(83)!
    size: 'number' #(84)!
showlegend: 'boolean' #(85)!
side: 'any' #(86)!
span: 'array' #(87)!
spanmode: 'any' #(88)!
stream:
  maxpoints: 'number' #(89)!
  token: 'string' #(90)!
text: 'string | array' #(91)!
textsrc: 'string' #(92)!
type: violin
uid: 'string' #(93)!
unselected:
  marker:
    color: 'any' #(94)!
    opacity: 'number' #(95)!
    size: 'number' #(96)!
visible: 'any' #(97)!
width: 'number' #(98)!
x: 'array' #(99)!
xaxis: 'string' #(100)!
xhoverformat: 'string' #(101)!
xsrc: 'string' #(102)!
y: 'array' #(103)!
yaxis: 'string' #(104)!
yhoverformat: 'string' #(105)!
ysrc: 'string' #(106)!
zorder: 'integer' #(107)!
- Set several traces linked to the same position axis or matching axes to the same alignmentgroup. This controls whether bars compute their positional range dependently or independently.
- Sets the bandwidth used to compute the kernel density estimate. By default, the bandwidth is determined by Silverman's rule of thumb.
- Sets the inner box plot fill color.
- Sets the inner box plot bounding line color.
- Sets the inner box plot bounding line width.
- Determines if an miniature box plot is drawn inside the violins.
- Sets the width of the inner box plots relative to the violins' width. For example, with 1, the inner box plots are as wide as the violins.
- Assigns extra data each datum. This may be useful when listening to hover, click and selection events. Note that, scatter traces also appends customdata items in the markers DOM elements
- Sets the source reference on Chart Studio Cloud for
customdata. - Sets the fill color. Defaults to a half-transparent variant of the line color, marker color, or marker line color, whichever is available.
- Determines which trace information appear on hover. If
noneorskipare set, no information is displayed upon hovering. But, ifnoneis set, click and hover events are still fired. - Sets the source reference on Chart Studio Cloud for
hoverinfo. - Sets the horizontal alignment of the text content within hover label box. Has an effect only if the hover label text spans more two or more lines
- Sets the source reference on Chart Studio Cloud for
align. - Sets the background color of the hover labels for this trace
- Sets the source reference on Chart Studio Cloud for
bgcolor. - Sets the border color of the hover labels for this trace.
- Sets the source reference on Chart Studio Cloud for
bordercolor. - Sets the source reference on Chart Studio Cloud for
color. - HTML font family - the typeface that will be applied by the web browser. The web browser can only apply a font if it is available on the system where it runs. Provide multiple font families, separated by commas, to indicate the order in which to apply fonts if they aren't available.
- Sets the source reference on Chart Studio Cloud for
family. - Sets the kind of decoration line(s) with text, such as an under, over or through as well as combinations e.g. under+over, etc.
- Sets the source reference on Chart Studio Cloud for
lineposition. - Sets the shape and color of the shadow behind text. auto places minimal shadow and applies contrast text font color. See https://developer.mozilla.org/en-US/docs/Web/CSS/text-shadow for additional options.
- Sets the source reference on Chart Studio Cloud for
shadow. - Sets the source reference on Chart Studio Cloud for
size. - Sets whether a font should be styled with a normal or italic face from its family.
- Sets the source reference on Chart Studio Cloud for
style. - Sets capitalization of text. It can be used to make text appear in all-uppercase or all-lowercase, or with each word capitalized.
- Sets the source reference on Chart Studio Cloud for
textcase. - Sets the variant of the font.
- Sets the source reference on Chart Studio Cloud for
variant. - Sets the weight (or boldness) of the font.
- Sets the source reference on Chart Studio Cloud for
weight. - Sets the default length (in number of characters) of the trace name in the hover labels for all traces. -1 shows the whole name regardless of length. 0-3 shows the first 0-3 characters, and an integer >3 will show the whole name if it is less than that many characters, but if it is longer, will truncate to
namelength - 3characters and add an ellipsis. - Sets the source reference on Chart Studio Cloud for
namelength. - Do the hover effects highlight individual violins or sample points or the kernel density estimate or any combination of them?
- Template string used for rendering the information that appear on hover box. Note that this will override
hoverinfo. Variables are inserted using %{variable}, for example "y: %{y}" as well as %{xother}, {%xother}, {%_xother}, {%xother_}. When showing info for several points, xother will be added to those with different x positions from the first point. An underscore before or after (x|y)other will add a space on that side, only when this field is shown. Numbers are formatted using d3-format's syntax %{variable:d3-format}, for example "Price: %{y:$.2f}". https://github.com/d3/d3-format/tree/v1.4.5#d3-format for details on the formatting syntax. Dates are formatted using d3-time-format's syntax %{variable|d3-time-format}, for example "Day: %{2019-01-01|%A}". https://github.com/d3/d3-time-format/tree/v2.2.3#locale_format for details on the date formatting syntax. The variables available inhovertemplateare the ones emitted as event data described at this link https://plotly.com/javascript/plotlyjs-events/#event-data. Additionally, every attributes that can be specified per-point (the ones that arearrayOk: true) are available. Anything contained in tag<extra>is displayed in the secondary box, for example "{fullData.name} ". To hide the secondary box completely, use an empty tag<extra></extra>. - Sets the source reference on Chart Studio Cloud for
hovertemplate. - Same as
text. - Sets the source reference on Chart Studio Cloud for
hovertext. - Assigns id labels to each datum. These ids for object constancy of data points during animation. Should be an array of strings, not numbers or any other type.
- Sets the source reference on Chart Studio Cloud for
ids. - Sets the amount of jitter in the sample points drawn. If 0, the sample points align along the distribution axis. If 1, the sample points are drawn in a random jitter of width equal to the width of the violins.
- Sets the reference to a legend to show this trace in. References to these legends are legend, legend2, legend3, etc. Settings for these legends are set in the layout, under
layout.legend,layout.legend2, etc. - Sets the legend group for this trace. Traces and shapes part of the same legend group hide/show at the same time when toggling legend items.
- HTML font family - the typeface that will be applied by the web browser. The web browser can only apply a font if it is available on the system where it runs. Provide multiple font families, separated by commas, to indicate the order in which to apply fonts if they aren't available.
- Sets the kind of decoration line(s) with text, such as an under, over or through as well as combinations e.g. under+over, etc.
- Sets the shape and color of the shadow behind text. auto places minimal shadow and applies contrast text font color. See https://developer.mozilla.org/en-US/docs/Web/CSS/text-shadow for additional options.
- Sets whether a font should be styled with a normal or italic face from its family.
- Sets capitalization of text. It can be used to make text appear in all-uppercase or all-lowercase, or with each word capitalized.
- Sets the variant of the font.
- Sets the weight (or boldness) of the font.
- Sets the title of the legend group.
- Sets the legend rank for this trace. Items and groups with smaller ranks are presented on top/left side while with reversed
legend.traceorderthey are on bottom/right side. The default legendrank is 1000, so that you can use ranks less than 1000 to place certain items before all unranked items, and ranks greater than 1000 to go after all unranked items. When having unranked or equal rank items shapes would be displayed after traces i.e. according to their order in data and layout. - Sets the width (in px or fraction) of the legend for this trace.
- Sets the color of line bounding the violin(s).
- Sets the width (in px) of line bounding the violin(s).
- Sets the marker angle in respect to
angleref. - Sets the marker color. It accepts either a specific color or an array of numbers that are mapped to the colorscale relative to the max and min values of the array or relative to
marker.cminandmarker.cmaxif set. - Sets the marker.line color. It accepts either a specific color or an array of numbers that are mapped to the colorscale relative to the max and min values of the array or relative to
marker.line.cminandmarker.line.cmaxif set. - Sets the border line color of the outlier sample points. Defaults to marker.color
- Sets the border line width (in px) of the outlier sample points.
- Sets the width (in px) of the lines bounding the marker points.
- Sets the marker opacity.
- Sets the color of the outlier sample points.
- Sets the marker size (in px).
- Sets the marker symbol type. Adding 100 is equivalent to appending -open to a symbol name. Adding 200 is equivalent to appending -dot to a symbol name. Adding 300 is equivalent to appending -open-dot or dot-open to a symbol name.
- Sets the mean line color.
- Determines if a line corresponding to the sample's mean is shown inside the violins. If
box.visibleis turned on, the mean line is drawn inside the inner box. Otherwise, the mean line is drawn from one side of the violin to other. - Sets the mean line width.
- Sets the source reference on Chart Studio Cloud for
meta. - Sets the trace name. The trace name appears as the legend item and on hover. For violin traces, the name will also be used for the position coordinate, if
xandx0(yandy0if horizontal) are missing and the position axis is categorical. Note that the trace name is also used as a default value for attributescalegroup(please see its description for details). - Set several traces linked to the same position axis or matching axes to the same offsetgroup where bars of the same position coordinate will line up.
- Sets the opacity of the trace.
- Sets the orientation of the violin(s). If v (h), the distribution is visualized along the vertical (horizontal).
- Sets the position of the sample points in relation to the violins. If 0, the sample points are places over the center of the violins. Positive (negative) values correspond to positions to the right (left) for vertical violins and above (below) for horizontal violins.
- If outliers, only the sample points lying outside the whiskers are shown If suspectedoutliers, the outlier points are shown and points either less than 4Q1-3Q3 or greater than 4Q3-3Q1 are highlighted (see
outliercolor) If all, all sample points are shown If false, only the violins are shown with no sample points. Defaults to suspectedoutliers whenmarker.outliercolorormarker.line.outliercoloris set, otherwise defaults to outliers. - Sets the method used to compute the sample's Q1 and Q3 quartiles. The linear method uses the 25th percentile for Q1 and 75th percentile for Q3 as computed using method #10 (listed on http://jse.amstat.org/v14n3/langford.html). The exclusive method uses the median to divide the ordered dataset into two halves if the sample is odd, it does not include the median in either half - Q1 is then the median of the lower half and Q3 the median of the upper half. The inclusive method also uses the median to divide the ordered dataset into two halves but if the sample is odd, it includes the median in both halves - Q1 is then the median of the lower half and Q3 the median of the upper half.
- If there are multiple violins that should be sized according to to some metric (see
scalemode), link them by providing a non-empty group id here shared by every trace in the same group. If a violin'swidthis undefined,scalegroupwill default to the trace's name. In this case, violins with the same names will be linked together - Sets the metric by which the width of each violin is determined. width means each violin has the same (max) width count means the violins are scaled by the number of sample points making up each violin.
- Sets the marker color of selected points.
- Sets the marker opacity of selected points.
- Sets the marker size of selected points.
- Determines whether or not an item corresponding to this trace is shown in the legend.
- Determines on which side of the position value the density function making up one half of a violin is plotted. Useful when comparing two violin traces under overlay mode, where one trace has
sideset to positive and the other to negative. - Sets the span in data space for which the density function will be computed. Has an effect only when
spanmodeis set to manual. - Sets the method by which the span in data space where the density function will be computed. soft means the span goes from the sample's minimum value minus two bandwidths to the sample's maximum value plus two bandwidths. hard means the span goes from the sample's minimum to its maximum value. For custom span settings, use mode manual and fill in the
spanattribute. - Sets the maximum number of points to keep on the plots from an incoming stream. If
maxpointsis set to 50, only the newest 50 points will be displayed on the plot. - The stream id number links a data trace on a plot with a stream. See https://chart-studio.plotly.com/settings for more details.
- Sets the text elements associated with each sample value. If a single string, the same string appears over all the data points. If an array of string, the items are mapped in order to the this trace's (x,y) coordinates. To be seen, trace
hoverinfomust contain a text flag. - Sets the source reference on Chart Studio Cloud for
text. - Assign an id to this trace, Use this to provide object constancy between traces during animations and transitions.
- Sets the marker color of unselected points, applied only when a selection exists.
- Sets the marker opacity of unselected points, applied only when a selection exists.
- Sets the marker size of unselected points, applied only when a selection exists.
- Determines whether or not this trace is visible. If legendonly, the trace is not drawn, but can appear as a legend item (provided that the legend itself is visible).
- Sets the width of the violin in data coordinates. If 0 (default value) the width is automatically selected based on the positions of other violin traces in the same subplot.
- Sets the x sample data or coordinates. See overview for more info.
- Sets a reference between this trace's x coordinates and a 2D cartesian x axis. If x (the default value), the x coordinates refer to
layout.xaxis. If x2, the x coordinates refer tolayout.xaxis2, and so on. - Sets the hover text formatting rulefor
xusing d3 formatting mini-languages which are very similar to those in Python. For numbers, see: https://github.com/d3/d3-format/tree/v1.4.5#d3-format. And for dates see: https://github.com/d3/d3-time-format/tree/v2.2.3#locale_format. We add two items to d3's date formatter: %h for half of the year as a decimal number as well as %{n}f for fractional seconds with n digits. For example, 2016-10-13 09:15:23.456 with tickformat %H~%M~%S.%2f would display 09~15~23.46By default the values are formatted usingxaxis.hoverformat. - Sets the source reference on Chart Studio Cloud for
x. - Sets the y sample data or coordinates. See overview for more info.
- Sets a reference between this trace's y coordinates and a 2D cartesian y axis. If y (the default value), the y coordinates refer to
layout.yaxis. If y2, the y coordinates refer tolayout.yaxis2, and so on. - Sets the hover text formatting rulefor
yusing d3 formatting mini-languages which are very similar to those in Python. For numbers, see: https://github.com/d3/d3-format/tree/v1.4.5#d3-format. And for dates see: https://github.com/d3/d3-time-format/tree/v2.2.3#locale_format. We add two items to d3's date formatter: %h for half of the year as a decimal number as well as %{n}f for fractional seconds with n digits. For example, 2016-10-13 09:15:23.456 with tickformat %H~%M~%S.%2f would display 09~15~23.46By default the values are formatted usingyaxis.hoverformat. - Sets the source reference on Chart Studio Cloud for
y. - Sets the layer on which this trace is displayed, relative to other SVG traces on the same subplot. SVG traces with higher
zorderappear in front of those with lowerzorder.