Waterfall
Overview
The waterfall trace type is used to create waterfall charts, which are useful for visualizing incremental changes in value over a series of categories or time. Waterfall charts are commonly used in financial and analytical contexts to show how sequential positive or negative values affect an initial value.
You can customize the colors, connectors, and base values to represent your data effectively.
Common Uses
- Financial Analysis: Visualizing profit and loss over time or across categories.
- Incremental Changes: Showing how individual positive or negative changes affect a starting value.
- Part-to-Whole Visualization: Highlighting how parts contribute to a cumulative total.
Check out the Attributes for the full set of configuration options
Examples
Common Configurations
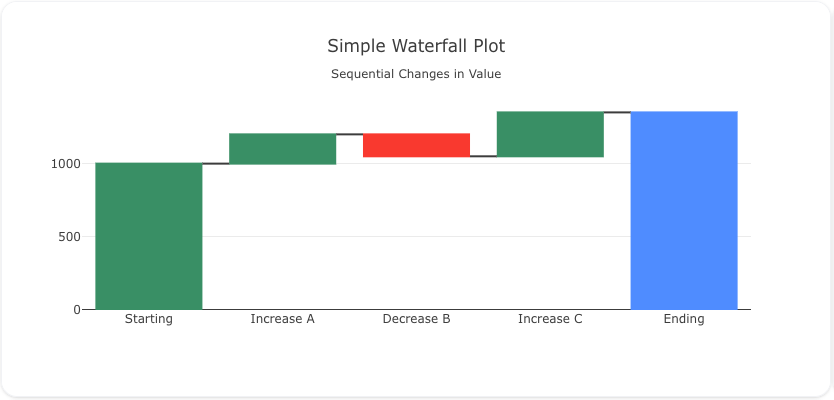
Here's a simple waterfall plot showing incremental changes across categories:
You can copy this code below to create this chart in your project:
models:
  - name: waterfall-data
    args:
      - echo
      - |
        idx,label,value
        0,Starting,1000
        1,Increase A,200
        2,Decrease B,-150
        3,Increase C,300
        4,Ending,1350
traces:
  - name: Simple Waterfall Plot
    model: ${ref(waterfall-data)}
    props:
      type: waterfall
      x: ?{label}
      y: ?{value}
      measure: ["initial", "relative", "relative", "relative", "total"]
    order_by:
      - ?{ idx asc}
charts:
  - name: Simple Waterfall Chart
    traces:
      - ${ref(Simple Waterfall Plot)}
    layout:
      title:
        text: Simple Waterfall Plot<br><sub>Sequential Changes in Value</sub>
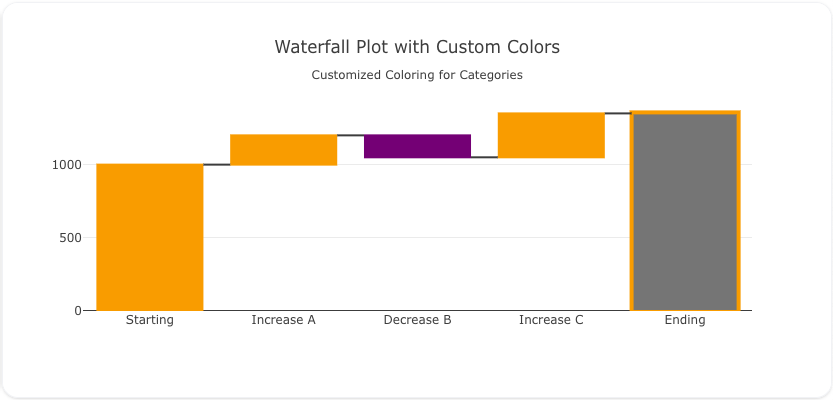
This example demonstrates a waterfall plot where the bars have custom colors for different categories:
Here's the code:
models:
  - name: waterfall-data-colors
    args:
      - echo
      - |
        idx,label,value,color
        0,Starting,1000,#1f77b4
        1,Increase A,200,#2ca02c
        2,Decrease B,-150,#d62728
        3,Increase C,300,#ff7f0e
        4,Ending,1350,#9467bd
traces:
  - name: Waterfall Plot with Custom Colors
    model: ${ref(waterfall-data-colors)}
    props:
      type: waterfall
      x: ?{label}
      y: ?{value}
      measure: ["initial", "relative", "relative", "relative", "total"]
      increasing:
        marker:
          color: 'orange'
      decreasing:
        marker:
          color: 'purple'
      totals:
        marker:
          color: 'grey'
          line:
            color: 'orange'
            width: 4
    order_by:
      - ?{ idx asc}
charts:
  - name: Waterfall Chart with Custom Colors
    traces:
      - ${ref(Waterfall Plot with Custom Colors)}
    layout:
      title:
        text: Waterfall Plot with Custom Colors<br><sub>Customized Coloring for Categories</sub>
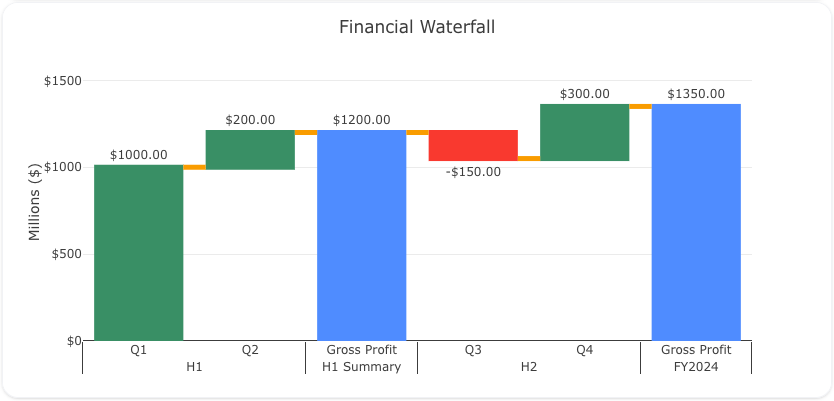
Here's a waterfall plot demonstrating a financial use case with connectors and custom formatting:
Here's the code:
models:
  - name: waterfall-data-connectors
    args:
      - echo
      - |
        idx,quarter,half,value,mode
        0,Q1,H1,1000,initial
        1,Q2,H1,200,relative
        2,Gross Profit,H1 Summary,0,total
        3,Q3,H2,-150,relative
        4,Q4,H2,300,relative
        5,Gross Profit,FY2024,0,total
traces:
  - name: Waterfall Plot with Connectors
    model: ${ref(waterfall-data-connectors)}
    props:
      type: waterfall
      x:
        - ?{half}
        - ?{quarter}
      y: ?{value}
      measure: ?{mode}
      hovertemplate: "%{x}: %{y:$.2f}"
      texttemplate: "%{delta:$.2f}"
      textposition: "outside"
      connector:
        line:
          color: "orange"
          width: 5
    order_by:
      - ?{ idx asc}
charts:
  - name: Waterfall Chart with Connectors
    traces:
      - ${ref(Waterfall Plot with Connectors)}
    layout:
      title:
        text: Financial Waterfall
      margin:
        b: 50
        t: 60
      yaxis:
        range: [0, 1600]
        tickprefix: '$'
        title:
          text: "Millions ($)"
A schema to validate plotly trace properties
Attributes
These attributes apply to traces where trace.props.type is set to waterfall. You would configure these attributes on the trace with the trace.props object.
alignmentgroup: 'string' #(1)!
base: 'number' #(2)!
cliponaxis: 'boolean' #(3)!
connector:
  line:
    color: 'any' #(4)!
    dash: 'string' #(5)!
    width: 'number' #(6)!
  mode: 'any' #(7)!
  visible: 'boolean' #(8)!
constraintext: 'any' #(9)!
customdata: 'array' #(10)!
customdatasrc: 'string' #(11)!
decreasing:
  marker:
    color: 'any' #(12)!
    line:
      color: 'any' #(13)!
      width: 'number' #(14)!
dx: 'number' #(15)!
dy: 'number' #(16)!
hoverinfo: 'array' #(17)!
hoverinfosrc: 'string' #(18)!
hoverlabel:
  align: 'array' #(19)!
  alignsrc: 'string' #(20)!
  bgcolor: 'color | array' #(21)!
  bgcolorsrc: 'string' #(22)!
  bordercolor: 'color | array' #(23)!
  bordercolorsrc: 'string' #(24)!
  font:
    color: color | array
    colorsrc: 'string' #(25)!
    family: 'string | array' #(26)!
    familysrc: 'string' #(27)!
    lineposition: 'array' #(28)!
    linepositionsrc: 'string' #(29)!
    shadow: 'string | array' #(30)!
    shadowsrc: 'string' #(31)!
    size: number | array
    sizesrc: 'string' #(32)!
    style: 'array' #(33)!
    stylesrc: 'string' #(34)!
    textcase: 'array' #(35)!
    textcasesrc: 'string' #(36)!
    variant: 'array' #(37)!
    variantsrc: 'string' #(38)!
    weight: 'integer | array' #(39)!
    weightsrc: 'string' #(40)!
  namelength: 'integer | array' #(41)!
  namelengthsrc: 'string' #(42)!
hovertemplate: 'string | array' #(43)!
hovertemplatesrc: 'string' #(44)!
hovertext: 'string | array' #(45)!
hovertextsrc: 'string' #(46)!
ids: 'array' #(47)!
idssrc: 'string' #(48)!
increasing:
  marker:
    color: 'any' #(49)!
    line:
      color: 'any' #(50)!
      width: 'number' #(51)!
insidetextanchor: 'any' #(52)!
insidetextfont:
  color: color | array
  colorsrc: 'string' #(53)!
  family: 'string | array' #(54)!
  familysrc: 'string' #(55)!
  lineposition: 'array' #(56)!
  linepositionsrc: 'string' #(57)!
  shadow: 'string | array' #(58)!
  shadowsrc: 'string' #(59)!
  size: number | array
  sizesrc: 'string' #(60)!
  style: 'array' #(61)!
  stylesrc: 'string' #(62)!
  textcase: 'array' #(63)!
  textcasesrc: 'string' #(64)!
  variant: 'array' #(65)!
  variantsrc: 'string' #(66)!
  weight: 'integer | array' #(67)!
  weightsrc: 'string' #(68)!
legend: 'string' #(69)!
legendgroup: 'string' #(70)!
legendgrouptitle:
  font:
    color: any
    family: 'string' #(71)!
    lineposition: 'string' #(72)!
    shadow: 'string' #(73)!
    size: number
    style: 'any' #(74)!
    textcase: 'any' #(75)!
    variant: 'any' #(76)!
    weight: 'integer' #(77)!
  text: 'string' #(78)!
legendrank: 'number' #(79)!
legendwidth: 'number' #(80)!
measure: 'array' #(81)!
measuresrc: 'string' #(82)!
metasrc: 'string' #(83)!
name: 'string' #(84)!
offset: 'number | array' #(85)!
offsetgroup: 'string' #(86)!
offsetsrc: 'string' #(87)!
opacity: 'number' #(88)!
orientation: 'any' #(89)!
outsidetextfont:
  color: color | array
  colorsrc: 'string' #(90)!
  family: 'string | array' #(91)!
  familysrc: 'string' #(92)!
  lineposition: 'array' #(93)!
  linepositionsrc: 'string' #(94)!
  shadow: 'string | array' #(95)!
  shadowsrc: 'string' #(96)!
  size: number | array
  sizesrc: 'string' #(97)!
  style: 'array' #(98)!
  stylesrc: 'string' #(99)!
  textcase: 'array' #(100)!
  textcasesrc: 'string' #(101)!
  variant: 'array' #(102)!
  variantsrc: 'string' #(103)!
  weight: 'integer | array' #(104)!
  weightsrc: 'string' #(105)!
showlegend: 'boolean' #(106)!
stream:
  maxpoints: 'number' #(107)!
  token: 'string' #(108)!
text: 'string | array' #(109)!
textangle: 'number' #(110)!
textfont:
  color: color | array
  colorsrc: 'string' #(111)!
  family: 'string | array' #(112)!
  familysrc: 'string' #(113)!
  lineposition: 'array' #(114)!
  linepositionsrc: 'string' #(115)!
  shadow: 'string | array' #(116)!
  shadowsrc: 'string' #(117)!
  size: number | array
  sizesrc: 'string' #(118)!
  style: 'array' #(119)!
  stylesrc: 'string' #(120)!
  textcase: 'array' #(121)!
  textcasesrc: 'string' #(122)!
  variant: 'array' #(123)!
  variantsrc: 'string' #(124)!
  weight: 'integer | array' #(125)!
  weightsrc: 'string' #(126)!
textinfo: 'string' #(127)!
textposition: 'array' #(128)!
textpositionsrc: 'string' #(129)!
textsrc: 'string' #(130)!
texttemplate: 'string | array' #(131)!
texttemplatesrc: 'string' #(132)!
totals:
  marker:
    color: 'any' #(133)!
    line:
      color: 'any' #(134)!
      width: 'number' #(135)!
type: waterfall
uid: 'string' #(136)!
visible: 'any' #(137)!
width: 'number | array' #(138)!
widthsrc: 'string' #(139)!
x: 'array' #(140)!
xaxis: 'string' #(141)!
xhoverformat: 'string' #(142)!
xperiodalignment: 'any' #(143)!
xsrc: 'string' #(144)!
y: 'array' #(145)!
yaxis: 'string' #(146)!
yhoverformat: 'string' #(147)!
yperiodalignment: 'any' #(148)!
ysrc: 'string' #(149)!
zorder: 'integer' #(150)!
- Set several traces linked to the same position axis or matching axes to the same alignmentgroup. This controls whether bars compute their positional range dependently or independently.
- Sets where the bar base is drawn (in position axis units).
- Determines whether the text nodes are clipped about the subplot axes. To show the text nodes above axis lines and tick labels, make sure to set
xaxis.layerandyaxis.layerto below traces. - Sets the line color.
- Sets the dash style of lines. Set to a dash type string (solid, dot, dash, longdash, dashdot, or longdashdot) or a dash length list in px (eg 5px,10px,2px,2px).
- Sets the line width (in px).
- Sets the shape of connector lines.
- Determines if connector lines are drawn.
- Constrain the size of text inside or outside a bar to be no larger than the bar itself.
- Assigns extra data each datum. This may be useful when listening to hover, click and selection events. Note that, scatter traces also appends customdata items in the markers DOM elements
- Sets the source reference on Chart Studio Cloud for
customdata. - Sets the marker color of all decreasing values.
- Sets the line color of all decreasing values.
- Sets the line width of all decreasing values.
- Sets the x coordinate step. See
x0for more info. - Sets the y coordinate step. See
y0for more info. - Determines which trace information appear on hover. If
noneorskipare set, no information is displayed upon hovering. But, ifnoneis set, click and hover events are still fired. - Sets the source reference on Chart Studio Cloud for
hoverinfo. - Sets the horizontal alignment of the text content within hover label box. Has an effect only if the hover label text spans more two or more lines
- Sets the source reference on Chart Studio Cloud for
align. - Sets the background color of the hover labels for this trace
- Sets the source reference on Chart Studio Cloud for
bgcolor. - Sets the border color of the hover labels for this trace.
- Sets the source reference on Chart Studio Cloud for
bordercolor. - Sets the source reference on Chart Studio Cloud for
color. - HTML font family - the typeface that will be applied by the web browser. The web browser can only apply a font if it is available on the system where it runs. Provide multiple font families, separated by commas, to indicate the order in which to apply fonts if they aren't available.
- Sets the source reference on Chart Studio Cloud for
family. - Sets the kind of decoration line(s) with text, such as an under, over or through as well as combinations e.g. under+over, etc.
- Sets the source reference on Chart Studio Cloud for
lineposition. - Sets the shape and color of the shadow behind text. auto places minimal shadow and applies contrast text font color. See https://developer.mozilla.org/en-US/docs/Web/CSS/text-shadow for additional options.
- Sets the source reference on Chart Studio Cloud for
shadow. - Sets the source reference on Chart Studio Cloud for
size. - Sets whether a font should be styled with a normal or italic face from its family.
- Sets the source reference on Chart Studio Cloud for
style. - Sets capitalization of text. It can be used to make text appear in all-uppercase or all-lowercase, or with each word capitalized.
- Sets the source reference on Chart Studio Cloud for
textcase. - Sets the variant of the font.
- Sets the source reference on Chart Studio Cloud for
variant. - Sets the weight (or boldness) of the font.
- Sets the source reference on Chart Studio Cloud for
weight. - Sets the default length (in number of characters) of the trace name in the hover labels for all traces. -1 shows the whole name regardless of length. 0-3 shows the first 0-3 characters, and an integer >3 will show the whole name if it is less than that many characters, but if it is longer, will truncate to
namelength - 3characters and add an ellipsis. - Sets the source reference on Chart Studio Cloud for
namelength. - Template string used for rendering the information that appear on hover box. Note that this will override
hoverinfo. Variables are inserted using %{variable}, for example "y: %{y}" as well as %{xother}, {%xother}, {%_xother}, {%xother_}. When showing info for several points, xother will be added to those with different x positions from the first point. An underscore before or after (x|y)other will add a space on that side, only when this field is shown. Numbers are formatted using d3-format's syntax %{variable:d3-format}, for example "Price: %{y:$.2f}". https://github.com/d3/d3-format/tree/v1.4.5#d3-format for details on the formatting syntax. Dates are formatted using d3-time-format's syntax %{variable|d3-time-format}, for example "Day: %{2019-01-01|%A}". https://github.com/d3/d3-time-format/tree/v2.2.3#locale_format for details on the date formatting syntax. The variables available inhovertemplateare the ones emitted as event data described at this link https://plotly.com/javascript/plotlyjs-events/#event-data. Additionally, every attributes that can be specified per-point (the ones that arearrayOk: true) are available. Finally, the template string has access to variablesinitial,deltaandfinal. Anything contained in tag<extra>is displayed in the secondary box, for example "{fullData.name} ". To hide the secondary box completely, use an empty tag<extra></extra>. - Sets the source reference on Chart Studio Cloud for
hovertemplate. - Sets hover text elements associated with each (x,y) pair. If a single string, the same string appears over all the data points. If an array of string, the items are mapped in order to the this trace's (x,y) coordinates. To be seen, trace
hoverinfomust contain a text flag. - Sets the source reference on Chart Studio Cloud for
hovertext. - Assigns id labels to each datum. These ids for object constancy of data points during animation. Should be an array of strings, not numbers or any other type.
- Sets the source reference on Chart Studio Cloud for
ids. - Sets the marker color of all increasing values.
- Sets the line color of all increasing values.
- Sets the line width of all increasing values.
- Determines if texts are kept at center or start/end points in
textpositioninside mode. - Sets the source reference on Chart Studio Cloud for
color. - HTML font family - the typeface that will be applied by the web browser. The web browser can only apply a font if it is available on the system where it runs. Provide multiple font families, separated by commas, to indicate the order in which to apply fonts if they aren't available.
- Sets the source reference on Chart Studio Cloud for
family. - Sets the kind of decoration line(s) with text, such as an under, over or through as well as combinations e.g. under+over, etc.
- Sets the source reference on Chart Studio Cloud for
lineposition. - Sets the shape and color of the shadow behind text. auto places minimal shadow and applies contrast text font color. See https://developer.mozilla.org/en-US/docs/Web/CSS/text-shadow for additional options.
- Sets the source reference on Chart Studio Cloud for
shadow. - Sets the source reference on Chart Studio Cloud for
size. - Sets whether a font should be styled with a normal or italic face from its family.
- Sets the source reference on Chart Studio Cloud for
style. - Sets capitalization of text. It can be used to make text appear in all-uppercase or all-lowercase, or with each word capitalized.
- Sets the source reference on Chart Studio Cloud for
textcase. - Sets the variant of the font.
- Sets the source reference on Chart Studio Cloud for
variant. - Sets the weight (or boldness) of the font.
- Sets the source reference on Chart Studio Cloud for
weight. - Sets the reference to a legend to show this trace in. References to these legends are legend, legend2, legend3, etc. Settings for these legends are set in the layout, under
layout.legend,layout.legend2, etc. - Sets the legend group for this trace. Traces and shapes part of the same legend group hide/show at the same time when toggling legend items.
- HTML font family - the typeface that will be applied by the web browser. The web browser can only apply a font if it is available on the system where it runs. Provide multiple font families, separated by commas, to indicate the order in which to apply fonts if they aren't available.
- Sets the kind of decoration line(s) with text, such as an under, over or through as well as combinations e.g. under+over, etc.
- Sets the shape and color of the shadow behind text. auto places minimal shadow and applies contrast text font color. See https://developer.mozilla.org/en-US/docs/Web/CSS/text-shadow for additional options.
- Sets whether a font should be styled with a normal or italic face from its family.
- Sets capitalization of text. It can be used to make text appear in all-uppercase or all-lowercase, or with each word capitalized.
- Sets the variant of the font.
- Sets the weight (or boldness) of the font.
- Sets the title of the legend group.
- Sets the legend rank for this trace. Items and groups with smaller ranks are presented on top/left side while with reversed
legend.traceorderthey are on bottom/right side. The default legendrank is 1000, so that you can use ranks less than 1000 to place certain items before all unranked items, and ranks greater than 1000 to go after all unranked items. When having unranked or equal rank items shapes would be displayed after traces i.e. according to their order in data and layout. - Sets the width (in px or fraction) of the legend for this trace.
- An array containing types of values. By default the values are considered as 'relative'. However; it is possible to use 'total' to compute the sums. Also 'absolute' could be applied to reset the computed total or to declare an initial value where needed.
- Sets the source reference on Chart Studio Cloud for
measure. - Sets the source reference on Chart Studio Cloud for
meta. - Sets the trace name. The trace name appears as the legend item and on hover.
- Shifts the position where the bar is drawn (in position axis units). In group barmode, traces that set offset will be excluded and drawn in overlay mode instead.
- Set several traces linked to the same position axis or matching axes to the same offsetgroup where bars of the same position coordinate will line up.
- Sets the source reference on Chart Studio Cloud for
offset. - Sets the opacity of the trace.
- Sets the orientation of the bars. With v (h), the value of the each bar spans along the vertical (horizontal).
- Sets the source reference on Chart Studio Cloud for
color. - HTML font family - the typeface that will be applied by the web browser. The web browser can only apply a font if it is available on the system where it runs. Provide multiple font families, separated by commas, to indicate the order in which to apply fonts if they aren't available.
- Sets the source reference on Chart Studio Cloud for
family. - Sets the kind of decoration line(s) with text, such as an under, over or through as well as combinations e.g. under+over, etc.
- Sets the source reference on Chart Studio Cloud for
lineposition. - Sets the shape and color of the shadow behind text. auto places minimal shadow and applies contrast text font color. See https://developer.mozilla.org/en-US/docs/Web/CSS/text-shadow for additional options.
- Sets the source reference on Chart Studio Cloud for
shadow. - Sets the source reference on Chart Studio Cloud for
size. - Sets whether a font should be styled with a normal or italic face from its family.
- Sets the source reference on Chart Studio Cloud for
style. - Sets capitalization of text. It can be used to make text appear in all-uppercase or all-lowercase, or with each word capitalized.
- Sets the source reference on Chart Studio Cloud for
textcase. - Sets the variant of the font.
- Sets the source reference on Chart Studio Cloud for
variant. - Sets the weight (or boldness) of the font.
- Sets the source reference on Chart Studio Cloud for
weight. - Determines whether or not an item corresponding to this trace is shown in the legend.
- Sets the maximum number of points to keep on the plots from an incoming stream. If
maxpointsis set to 50, only the newest 50 points will be displayed on the plot. - The stream id number links a data trace on a plot with a stream. See https://chart-studio.plotly.com/settings for more details.
- Sets text elements associated with each (x,y) pair. If a single string, the same string appears over all the data points. If an array of string, the items are mapped in order to the this trace's (x,y) coordinates. If trace
hoverinfocontains a text flag and hovertext is not set, these elements will be seen in the hover labels. - Sets the angle of the tick labels with respect to the bar. For example, a
tickangleof -90 draws the tick labels vertically. With auto the texts may automatically be rotated to fit with the maximum size in bars. - Sets the source reference on Chart Studio Cloud for
color. - HTML font family - the typeface that will be applied by the web browser. The web browser can only apply a font if it is available on the system where it runs. Provide multiple font families, separated by commas, to indicate the order in which to apply fonts if they aren't available.
- Sets the source reference on Chart Studio Cloud for
family. - Sets the kind of decoration line(s) with text, such as an under, over or through as well as combinations e.g. under+over, etc.
- Sets the source reference on Chart Studio Cloud for
lineposition. - Sets the shape and color of the shadow behind text. auto places minimal shadow and applies contrast text font color. See https://developer.mozilla.org/en-US/docs/Web/CSS/text-shadow for additional options.
- Sets the source reference on Chart Studio Cloud for
shadow. - Sets the source reference on Chart Studio Cloud for
size. - Sets whether a font should be styled with a normal or italic face from its family.
- Sets the source reference on Chart Studio Cloud for
style. - Sets capitalization of text. It can be used to make text appear in all-uppercase or all-lowercase, or with each word capitalized.
- Sets the source reference on Chart Studio Cloud for
textcase. - Sets the variant of the font.
- Sets the source reference on Chart Studio Cloud for
variant. - Sets the weight (or boldness) of the font.
- Sets the source reference on Chart Studio Cloud for
weight. - Determines which trace information appear on the graph. In the case of having multiple waterfalls, totals are computed separately (per trace).
- Specifies the location of the
text. inside positionstextinside, next to the bar end (rotated and scaled if needed). outside positionstextoutside, next to the bar end (scaled if needed), unless there is another bar stacked on this one, then the text gets pushed inside. auto tries to positiontextinside the bar, but if the bar is too small and no bar is stacked on this one the text is moved outside. If none, no text appears. - Sets the source reference on Chart Studio Cloud for
textposition. - Sets the source reference on Chart Studio Cloud for
text. - Template string used for rendering the information text that appear on points. Note that this will override
textinfo. Variables are inserted using %{variable}, for example "y: %{y}". Numbers are formatted using d3-format's syntax %{variable:d3-format}, for example "Price: %{y:$.2f}". https://github.com/d3/d3-format/tree/v1.4.5#d3-format for details on the formatting syntax. Dates are formatted using d3-time-format's syntax %{variable|d3-time-format}, for example "Day: %{2019-01-01|%A}". https://github.com/d3/d3-time-format/tree/v2.2.3#locale_format for details on the date formatting syntax. Every attributes that can be specified per-point (the ones that arearrayOk: true) are available. Finally, the template string has access to variablesinitial,delta,finalandlabel. - Sets the source reference on Chart Studio Cloud for
texttemplate. - Sets the marker color of all intermediate sums and total values.
- Sets the line color of all intermediate sums and total values.
- Sets the line width of all intermediate sums and total values.
- Assign an id to this trace, Use this to provide object constancy between traces during animations and transitions.
- Determines whether or not this trace is visible. If legendonly, the trace is not drawn, but can appear as a legend item (provided that the legend itself is visible).
- Sets the bar width (in position axis units).
- Sets the source reference on Chart Studio Cloud for
width. - Sets the x coordinates.
- Sets a reference between this trace's x coordinates and a 2D cartesian x axis. If x (the default value), the x coordinates refer to
layout.xaxis. If x2, the x coordinates refer tolayout.xaxis2, and so on. - Sets the hover text formatting rulefor
xusing d3 formatting mini-languages which are very similar to those in Python. For numbers, see: https://github.com/d3/d3-format/tree/v1.4.5#d3-format. And for dates see: https://github.com/d3/d3-time-format/tree/v2.2.3#locale_format. We add two items to d3's date formatter: %h for half of the year as a decimal number as well as %{n}f for fractional seconds with n digits. For example, 2016-10-13 09:15:23.456 with tickformat %H~%M~%S.%2f would display 09~15~23.46By default the values are formatted usingxaxis.hoverformat. - Only relevant when the axis
typeis date. Sets the alignment of data points on the x axis. - Sets the source reference on Chart Studio Cloud for
x. - Sets the y coordinates.
- Sets a reference between this trace's y coordinates and a 2D cartesian y axis. If y (the default value), the y coordinates refer to
layout.yaxis. If y2, the y coordinates refer tolayout.yaxis2, and so on. - Sets the hover text formatting rulefor
yusing d3 formatting mini-languages which are very similar to those in Python. For numbers, see: https://github.com/d3/d3-format/tree/v1.4.5#d3-format. And for dates see: https://github.com/d3/d3-time-format/tree/v2.2.3#locale_format. We add two items to d3's date formatter: %h for half of the year as a decimal number as well as %{n}f for fractional seconds with n digits. For example, 2016-10-13 09:15:23.456 with tickformat %H~%M~%S.%2f would display 09~15~23.46By default the values are formatted usingyaxis.hoverformat. - Only relevant when the axis
typeis date. Sets the alignment of data points on the y axis. - Sets the source reference on Chart Studio Cloud for
y. - Sets the layer on which this trace is displayed, relative to other SVG traces on the same subplot. SVG traces with higher
zorderappear in front of those with lowerzorder.