How Visivo Works
When working with Visivo, all you have to do is write yaml configurations & CLI commands. Visivo handles everything else automatically so you and your team can focus on just the stuff that matters. While the example that we will go through here is not exactly how Visivo functions under the hood, it's a pretty nice approximation to give you an idea of how the sauce is made!
Say you have a model called widget_sales that looks like this:
| widget | quantity | completed_at |
|---|---|---|
| Useful Widget | 300 | 2023-01-01 |
| Useful Widget | 250 | 2023-01-07 |
| Useful Widget | 150 | 2023-01-08 |
| Expensive Widget | 900 | 2023-01-02 |
| Expensive Widget | 50 | 2023-01-03 |
| Expensive Widget | 50 | 2023-01-09 |
You can write a trace in any yml file directly your project. The trace can be just a few lines or more complex if you want to customize it. Here's an example of a fairly simple trace that builds on the widget_sales model:
models:
- name: widget_sales
sql: select * from widget_sales
traces:
- name: simple_trace
model: ${ref(widget_sales)}
cohort_on: widget
props:
x: ?{ date_trunc('week', completed_at) }
y: ?{ sum(amount) }
marker:
color: ?{ case sum(amount) > 200 then 'green' else 'blue' end }
shape: square
mode: 'lines'
charts:
- name: simple_chart
traces:
- ${ref(simple_trace)}
layout:
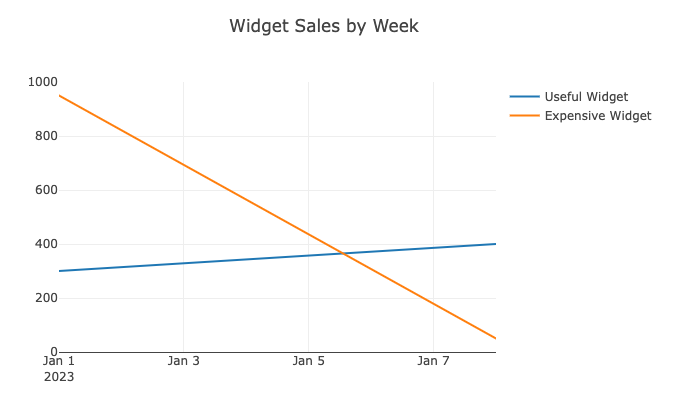
- title: Widget Sales by Week
traces:
  - name: simple_trace
    model: ${ref(widget_sales)}
    cohort_on: ?{ widget }
    props:
      x: ?{ date_trunc('week', completed_at) }
      y: ?{ sum(amount) }
      marker:
        color: ?{ case sum(amount) > 200 then 'green' else 'blue' end }
        shape: square
      mode: 'lines'
charts:
  - name: simple_chart
    traces:
      - ${ref(simple_trace)}
    layout:
      - title: Widget Sales by Week
models:
  - name: widget_sales
    description: "A table containing widgets sales sourced from the CRM"
    columns:
      - name: widget
        description: The type of widget sold
      - name: quantity
        description: The number of widgets sold
      - name: completed_at
        description: Timestamp of when the transaction occurred
SELECT
  widget,
  quantity,
  completed_at
FROM {{ source('crm', 'sales_of_widgets') }}
Using that context, Visivo will produce this query and store it in your target directory:
WITH
sql as (
select * from widget_sales --context set to target.database & target.schema
)
select
  widget as "cohort_on",
  date_trunc('week', completed_at) as "x",
  sum(amount) as "y",
  case sum(amount) > 300 then 'green' else 'blue' end as "marker.color"
from sql
GROUP BY
  "cohort_on",
  "x"
data.json which is stored in the target directly next to the query to enable debugging:
{
"Useful Widget": {
  "x": ["2023-01-01", "2023-01-08"],
  "y": [300, 400],
  "marker.color": ["blue", "green"]
  },
"Expensive Widget": {
  "x": ["2023-01-01", "2023-01-08"],
  "y": [950, 50],
  "marker.color": ["green", "blue"]
  }
}
...

var traces = [
  {
    name: "Useful Widget",
    x: data["Useful Widget"]["x"],
    y: data["Useful Widget"]["y"],
    marker: {
      color: data["Useful Widget"]["marker.color"],
      shape: "square"
    },
    mode: "lines"
  },
  {
    name: "Expensive Widget",
    x: data["Expensive Widget"]["x"],
    y: data["Expensive Widget"]["y"],
    marker: {
      color: data["Expensive Widget"]["marker.color"],
      shape: "square"
    },
    mode: "lines"
  },
]
var layout = {title: "Widget Sales by Week" }

Plotly.newPlot('aDiv', data, layout);