Scatter (line, area & scatter)
Overview
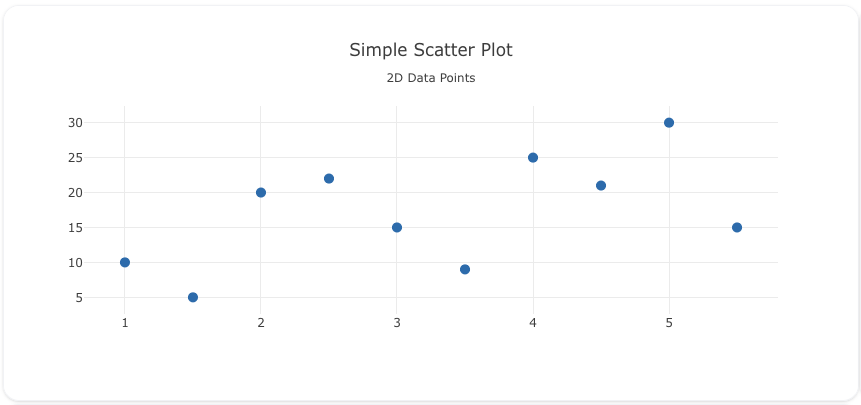
The scatter trace type is used to create scatter plots, which visualize data points based on two numerical variables. Scatter plots are widely used for analyzing relationships between variables, identifying trends, and detecting outliers.
Gotchas
- Scatter traces are also used to generate area and line traces.
- The line connections of a scatter trace are determined by the
trace.order_byattribute. Make sure to set that to get a deterministic trace for lines and area permutations.
You can customize the marker size, color, and add lines to connect the points to represent the data in various forms like scatter plots, line charts, and more.
Common Uses
- Relationship Analysis: Exploring the relationship between two variables.
- Trend Detection: Identifying trends or patterns in data.
- Outlier Identification: Spotting outliers in data distributions.
Check out the Attributes for the full set of configuration options
Examples
Common Configurations
Here's a simple scatter plot showing data points on a 2D plane:
You can copy this code below to create this chart in your project:
models:
  - name: scatter-data
    args:
      - echo
      - |
        x,y
        1,10
        2,20
        3,15
        4,25
        5,30
        1.5,5
        2.5,22
        3.5,9
        4.5,21
        5.5,15

traces:
  - name: Simple Scatter Plot
    model: ${ref(scatter-data)}
    props:
      type: scatter
      x: ?{x}
      y: ?{y}
      mode: "markers"
      marker:
        size: 10
    order_by:
      - ?{x asc}
charts:
  - name: Simple Scatter Chart
    traces:
      - ${ref(Simple Scatter Plot)}
    layout:
      title:
        text: Simple Scatter Plot<br><sub>2D Data Points</sub>
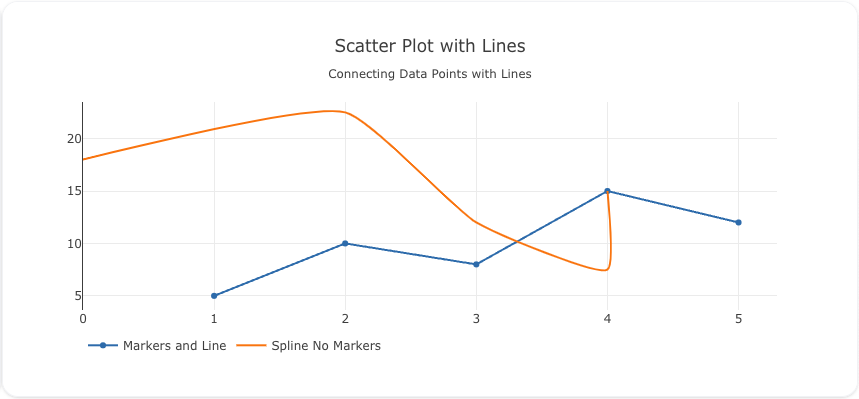
This example demonstrates a scatter plot with lines connecting the data points to show trends:
Here's the code:
models:
  - name: scatter-data-lines
    args:
      - echo
      - |
        x,y
        1,5
        2,10
        3,8
        4,15
        5,12
traces:
  - name: Markers and Line
    model: ${ref(scatter-data-lines)}
    props:
      type: scatter
      x: ?{x}
      y: ?{y}
      mode: "lines+markers"
    order_by:
      - ?{x asc}
  - name: Spline No Markers
    model: ${ref(scatter-data-lines)}
    props:
      type: scatter
      x: ?{x+3 - (x*x)/3}
      y: ?{y*1.5}
      mode: "lines"
      line:
        shape: spline
        smoothing: .5 #Sets spline bend
    order_by:
      - ?{x+3 - (x*x)/3}
charts:
  - name: Scatter Chart with Lines
    traces:
      - ${ref(Markers and Line)}
      - ${ref(Spline No Markers)}
    layout:
      title:
        text: Scatter Plot with Lines<br><sub>Connecting Data Points with Lines</sub>
      legend:
        orientation: h
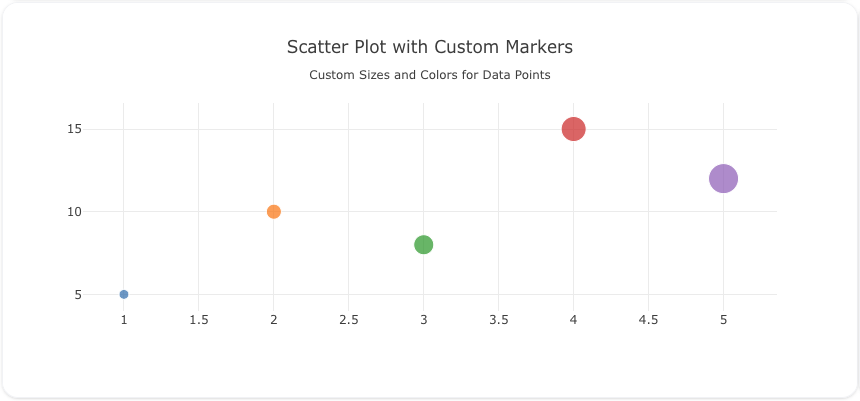
Here's a scatter plot with custom marker sizes and colors, giving more visual weight to each data point:
Here's the code:
models:
  - name: scatter-data-custom
    args:
      - echo
      - |
        x,y,size,color
        1,5,10,#1f77b4
        2,10,15,#ff7f0e
        3,8,20,#2ca02c
        4,15,25,#d62728
        5,12,30,#9467bd
traces:
  - name: Scatter Plot with Custom Markers
    model: ${ref(scatter-data-custom)}
    props:
      type: scatter
      x: ?{x}
      y: ?{y}
      mode: "markers"
      marker:
        size: ?{size}
        color: ?{color}
    order_by:
      - ?{x asc}
charts:
  - name: Scatter Chart with Custom Markers
    traces:
      - ${ref(Scatter Plot with Custom Markers)}
    layout:
      title:
        text: Scatter Plot with Custom Markers<br><sub>Custom Sizes and Colors for Data Points</sub>
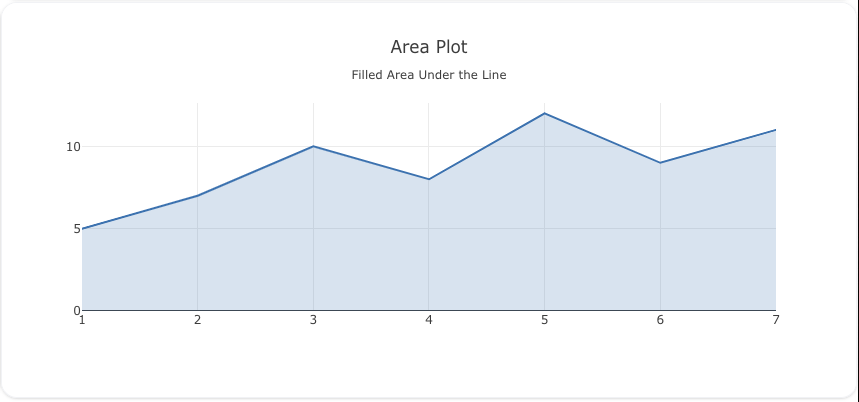
Here's a scatter plot used to create an area plot, filling the area under the line:
Here's the code:
models:
  - name: area-plot-data
    args:
      - echo
      - |
        x,y
        1,5
        2,7
        3,10
        4,8
        5,12
        6,9
        7,11
traces:
  - name: Area Plot
    model: ${ref(area-plot-data)}
    props:
      type: scatter
      x: ?{x}
      y: ?{y}
      mode: "lines"
      fill: "tozeroy"
      fillcolor: "rgba(55, 126, 184, 0.2)"
      line:
        color: "rgb(55, 126, 184)"
        width: 2
    order_by:
      - ?{x asc}
charts:
  - name: Area Plot Chart
    traces:
      - ${ref(Area Plot)}
    layout:
      title:
        text: Area Plot<br><sub>Filled Area Under the Line</sub>
A schema to validate plotly trace properties
Attributes
These attributes apply to traces where trace.props.type is set to scatter. You would configure these attributes on the trace with the trace.props object.
alignmentgroup: 'string' #(1)!
cliponaxis: 'boolean' #(2)!
connectgaps: 'boolean' #(3)!
customdata: 'array' #(4)!
customdatasrc: 'string' #(5)!
dx: 'number' #(6)!
dy: 'number' #(7)!
error_x:
  array: 'array' #(8)!
  arrayminus: 'array' #(9)!
  arrayminussrc: 'string' #(10)!
  arraysrc: 'string' #(11)!
  color: 'any' #(12)!
  copy_ystyle: boolean
  symmetric: 'boolean' #(13)!
  thickness: 'number' #(14)!
  traceref: integer
  tracerefminus: integer
  type: 'any' #(15)!
  value: 'number' #(16)!
  valueminus: 'number' #(17)!
  visible: 'boolean' #(18)!
  width: 'number' #(19)!
error_y:
  array: 'array' #(20)!
  arrayminus: 'array' #(21)!
  arrayminussrc: 'string' #(22)!
  arraysrc: 'string' #(23)!
  color: 'any' #(24)!
  symmetric: 'boolean' #(25)!
  thickness: 'number' #(26)!
  traceref: integer
  tracerefminus: integer
  type: 'any' #(27)!
  value: 'number' #(28)!
  valueminus: 'number' #(29)!
  visible: 'boolean' #(30)!
  width: 'number' #(31)!
fill: 'any' #(32)!
fillcolor: 'any' #(33)!
fillgradient:
  colorscale: 'any' #(34)!
  start: 'number' #(35)!
  stop: 'number' #(36)!
  type: 'any' #(37)!
fillpattern:
  bgcolor: 'color | array' #(38)!
  bgcolorsrc: 'string' #(39)!
  fgcolor: 'color | array' #(40)!
  fgcolorsrc: 'string' #(41)!
  fgopacity: 'number' #(42)!
  fillmode: 'any' #(43)!
  shape: 'array' #(44)!
  shapesrc: 'string' #(45)!
  size: 'number | array' #(46)!
  sizesrc: 'string' #(47)!
  solidity: 'number | array' #(48)!
  soliditysrc: 'string' #(49)!
groupnorm: 'any' #(50)!
hoverinfo: 'array' #(51)!
hoverinfosrc: 'string' #(52)!
hoverlabel:
  align: 'array' #(53)!
  alignsrc: 'string' #(54)!
  bgcolor: 'color | array' #(55)!
  bgcolorsrc: 'string' #(56)!
  bordercolor: 'color | array' #(57)!
  bordercolorsrc: 'string' #(58)!
  font:
    color: color | array
    colorsrc: 'string' #(59)!
    family: 'string | array' #(60)!
    familysrc: 'string' #(61)!
    lineposition: 'array' #(62)!
    linepositionsrc: 'string' #(63)!
    shadow: 'string | array' #(64)!
    shadowsrc: 'string' #(65)!
    size: number | array
    sizesrc: 'string' #(66)!
    style: 'array' #(67)!
    stylesrc: 'string' #(68)!
    textcase: 'array' #(69)!
    textcasesrc: 'string' #(70)!
    variant: 'array' #(71)!
    variantsrc: 'string' #(72)!
    weight: 'integer | array' #(73)!
    weightsrc: 'string' #(74)!
  namelength: 'integer | array' #(75)!
  namelengthsrc: 'string' #(76)!
hoveron: 'string' #(77)!
hovertemplate: 'string | array' #(78)!
hovertemplatesrc: 'string' #(79)!
hovertext: 'string | array' #(80)!
hovertextsrc: 'string' #(81)!
ids: 'array' #(82)!
idssrc: 'string' #(83)!
legend: 'string' #(84)!
legendgroup: 'string' #(85)!
legendgrouptitle:
  font:
    color: any
    family: 'string' #(86)!
    lineposition: 'string' #(87)!
    shadow: 'string' #(88)!
    size: number
    style: 'any' #(89)!
    textcase: 'any' #(90)!
    variant: 'any' #(91)!
    weight: 'integer' #(92)!
  text: 'string' #(93)!
legendrank: 'number' #(94)!
legendwidth: 'number' #(95)!
line:
  backoff: 'number | array' #(96)!
  backoffsrc: 'string' #(97)!
  color: 'any' #(98)!
  dash: 'string' #(99)!
  shape: 'any' #(100)!
  simplify: 'boolean' #(101)!
  smoothing: 'number' #(102)!
  width: 'number' #(103)!
marker:
  angle: 'number | array' #(104)!
  angleref: 'any' #(105)!
  anglesrc: 'string' #(106)!
  autocolorscale: 'boolean' #(107)!
  cauto: 'boolean' #(108)!
  cmax: 'number' #(109)!
  cmid: 'number' #(110)!
  cmin: 'number' #(111)!
  color: 'color | array' #(112)!
  coloraxis: 'string' #(113)!
  colorbar:
    bgcolor: 'any' #(114)!
    bordercolor: 'any' #(115)!
    borderwidth: 'number' #(116)!
    exponentformat: 'any' #(117)!
    len: 'number' #(118)!
    lenmode: 'any' #(119)!
    minexponent: 'number' #(120)!
    nticks: 'integer' #(121)!
    orientation: 'any' #(122)!
    outlinecolor: 'any' #(123)!
    outlinewidth: 'number' #(124)!
    separatethousands: 'boolean' #(125)!
    showexponent: 'any' #(126)!
    showticklabels: 'boolean' #(127)!
    showtickprefix: 'any' #(128)!
    showticksuffix: 'any' #(129)!
    thickness: 'number' #(130)!
    thicknessmode: 'any' #(131)!
    tickangle: 'number' #(132)!
    tickcolor: 'any' #(133)!
    tickfont:
      color: any
      family: 'string' #(134)!
      lineposition: 'string' #(135)!
      shadow: 'string' #(136)!
      size: number
      style: 'any' #(137)!
      textcase: 'any' #(138)!
      variant: 'any' #(139)!
      weight: 'integer' #(140)!
    tickformat: 'string' #(141)!
    tickformatstops: array
    ticklabeloverflow: 'any' #(142)!
    ticklabelposition: 'any' #(143)!
    ticklabelstep: 'integer' #(144)!
    ticklen: 'number' #(145)!
    tickmode: 'any' #(146)!
    tickprefix: 'string' #(147)!
    ticks: 'any' #(148)!
    ticksuffix: 'string' #(149)!
    ticktext: 'array' #(150)!
    ticktextsrc: 'string' #(151)!
    tickvals: 'array' #(152)!
    tickvalssrc: 'string' #(153)!
    tickwidth: 'number' #(154)!
    title:
      font:
        color: any
        family: 'string' #(155)!
        lineposition: 'string' #(156)!
        shadow: 'string' #(157)!
        size: number
        style: 'any' #(158)!
        textcase: 'any' #(159)!
        variant: 'any' #(160)!
        weight: 'integer' #(161)!
      side: 'any' #(162)!
      text: 'string' #(163)!
    x: 'number' #(164)!
    xanchor: 'any' #(165)!
    xpad: 'number' #(166)!
    xref: 'any' #(167)!
    y: 'number' #(168)!
    yanchor: 'any' #(169)!
    ypad: 'number' #(170)!
    yref: 'any' #(171)!
  colorscale: 'any' #(172)!
  colorsrc: 'string' #(173)!
  gradient:
    color: 'color | array' #(174)!
    colorsrc: 'string' #(175)!
    type: 'array' #(176)!
    typesrc: 'string' #(177)!
  line:
    autocolorscale: 'boolean' #(178)!
    cauto: 'boolean' #(179)!
    cmax: 'number' #(180)!
    cmid: 'number' #(181)!
    cmin: 'number' #(182)!
    color: 'color | array' #(183)!
    coloraxis: 'string' #(184)!
    colorscale: 'any' #(185)!
    colorsrc: 'string' #(186)!
    reversescale: 'boolean' #(187)!
    width: 'number | array' #(188)!
    widthsrc: 'string' #(189)!
  maxdisplayed: 'number' #(190)!
  opacity: 'number | array' #(191)!
  opacitysrc: 'string' #(192)!
  reversescale: 'boolean' #(193)!
  showscale: 'boolean' #(194)!
  size: 'number | array' #(195)!
  sizemin: 'number' #(196)!
  sizemode: 'any' #(197)!
  sizeref: 'number' #(198)!
  sizesrc: 'string' #(199)!
  standoff: 'number | array' #(200)!
  standoffsrc: 'string' #(201)!
  symbol: 'array' #(202)!
  symbolsrc: 'string' #(203)!
metasrc: 'string' #(204)!
mode: 'string' #(205)!
name: 'string' #(206)!
offsetgroup: 'string' #(207)!
opacity: 'number' #(208)!
orientation: 'any' #(209)!
selected:
  marker:
    color: 'any' #(210)!
    opacity: 'number' #(211)!
    size: 'number' #(212)!
  textfont:
    color: 'any' #(213)!
showlegend: 'boolean' #(214)!
stackgaps: 'any' #(215)!
stackgroup: 'string' #(216)!
stream:
  maxpoints: 'number' #(217)!
  token: 'string' #(218)!
text: 'string | array' #(219)!
textfont:
  color: color | array
  colorsrc: 'string' #(220)!
  family: 'string | array' #(221)!
  familysrc: 'string' #(222)!
  lineposition: 'array' #(223)!
  linepositionsrc: 'string' #(224)!
  shadow: 'string | array' #(225)!
  shadowsrc: 'string' #(226)!
  size: number | array
  sizesrc: 'string' #(227)!
  style: 'array' #(228)!
  stylesrc: 'string' #(229)!
  textcase: 'array' #(230)!
  textcasesrc: 'string' #(231)!
  variant: 'array' #(232)!
  variantsrc: 'string' #(233)!
  weight: 'integer | array' #(234)!
  weightsrc: 'string' #(235)!
textposition: 'array' #(236)!
textpositionsrc: 'string' #(237)!
textsrc: 'string' #(238)!
texttemplate: 'string | array' #(239)!
texttemplatesrc: 'string' #(240)!
type: scatter
uid: 'string' #(241)!
unselected:
  marker:
    color: 'any' #(242)!
    opacity: 'number' #(243)!
    size: 'number' #(244)!
  textfont:
    color: 'any' #(245)!
visible: 'any' #(246)!
x: 'array' #(247)!
xaxis: 'string' #(248)!
xcalendar: 'any' #(249)!
xhoverformat: 'string' #(250)!
xperiodalignment: 'any' #(251)!
xsrc: 'string' #(252)!
y: 'array' #(253)!
yaxis: 'string' #(254)!
ycalendar: 'any' #(255)!
yhoverformat: 'string' #(256)!
yperiodalignment: 'any' #(257)!
ysrc: 'string' #(258)!
zorder: 'integer' #(259)!
- Set several traces linked to the same position axis or matching axes to the same alignmentgroup. This controls whether bars compute their positional range dependently or independently.
- Determines whether or not markers and text nodes are clipped about the subplot axes. To show markers and text nodes above axis lines and tick labels, make sure to set
xaxis.layerandyaxis.layerto below traces. - Determines whether or not gaps (i.e. {nan} or missing values) in the provided data arrays are connected.
- Assigns extra data each datum. This may be useful when listening to hover, click and selection events. Note that, scatter traces also appends customdata items in the markers DOM elements
- Sets the source reference on Chart Studio Cloud for
customdata. - Sets the x coordinate step. See
x0for more info. - Sets the y coordinate step. See
y0for more info. - Sets the data corresponding the length of each error bar. Values are plotted relative to the underlying data.
- Sets the data corresponding the length of each error bar in the bottom (left) direction for vertical (horizontal) bars Values are plotted relative to the underlying data.
- Sets the source reference on Chart Studio Cloud for
arrayminus. - Sets the source reference on Chart Studio Cloud for
array. - Sets the stroke color of the error bars.
- Determines whether or not the error bars have the same length in both direction (top/bottom for vertical bars, left/right for horizontal bars.
- Sets the thickness (in px) of the error bars.
- Determines the rule used to generate the error bars. If *constant
, the bar lengths are of a constant value. Set this constant invalue. If *percent*, the bar lengths correspond to a percentage of underlying data. Set this percentage invalue. If *sqrt*, the bar lengths correspond to the square of the underlying data. If *data*, the bar lengths are set with data setarray`. - Sets the value of either the percentage (if
typeis set to percent) or the constant (iftypeis set to constant) corresponding to the lengths of the error bars. - Sets the value of either the percentage (if
typeis set to percent) or the constant (iftypeis set to constant) corresponding to the lengths of the error bars in the bottom (left) direction for vertical (horizontal) bars - Determines whether or not this set of error bars is visible.
- Sets the width (in px) of the cross-bar at both ends of the error bars.
- Sets the data corresponding the length of each error bar. Values are plotted relative to the underlying data.
- Sets the data corresponding the length of each error bar in the bottom (left) direction for vertical (horizontal) bars Values are plotted relative to the underlying data.
- Sets the source reference on Chart Studio Cloud for
arrayminus. - Sets the source reference on Chart Studio Cloud for
array. - Sets the stroke color of the error bars.
- Determines whether or not the error bars have the same length in both direction (top/bottom for vertical bars, left/right for horizontal bars.
- Sets the thickness (in px) of the error bars.
- Determines the rule used to generate the error bars. If *constant
, the bar lengths are of a constant value. Set this constant invalue. If *percent*, the bar lengths correspond to a percentage of underlying data. Set this percentage invalue. If *sqrt*, the bar lengths correspond to the square of the underlying data. If *data*, the bar lengths are set with data setarray`. - Sets the value of either the percentage (if
typeis set to percent) or the constant (iftypeis set to constant) corresponding to the lengths of the error bars. - Sets the value of either the percentage (if
typeis set to percent) or the constant (iftypeis set to constant) corresponding to the lengths of the error bars in the bottom (left) direction for vertical (horizontal) bars - Determines whether or not this set of error bars is visible.
- Sets the width (in px) of the cross-bar at both ends of the error bars.
- Sets the area to fill with a solid color. Defaults to none unless this trace is stacked, then it gets tonexty (tonextx) if
orientationis v (h) Use withfillcolorif not none. tozerox and tozeroy fill to x=0 and y=0 respectively. tonextx and tonexty fill between the endpoints of this trace and the endpoints of the trace before it, connecting those endpoints with straight lines (to make a stacked area graph); if there is no trace before it, they behave like tozerox and tozeroy. toself connects the endpoints of the trace (or each segment of the trace if it has gaps) into a closed shape. tonext fills the space between two traces if one completely encloses the other (eg consecutive contour lines), and behaves like toself if there is no trace before it. tonext should not be used if one trace does not enclose the other. Traces in astackgroupwill only fill to (or be filled to) other traces in the same group. With multiplestackgroups or some traces stacked and some not, if fill-linked traces are not already consecutive, the later ones will be pushed down in the drawing order. - Sets the fill color. Defaults to a half-transparent variant of the line color, marker color, or marker line color, whichever is available. If fillgradient is specified, fillcolor is ignored except for setting the background color of the hover label, if any.
- Sets the fill gradient colors as a color scale. The color scale is interpreted as a gradient applied in the direction specified by orientation, from the lowest to the highest value of the scatter plot along that axis, or from the center to the most distant point from it, if orientation is radial.
- Sets the gradient start value. It is given as the absolute position on the axis determined by the orientation. E.g., if orientation is horizontal, the gradient will be horizontal and start from the x-position given by start. If omitted, the gradient starts at the lowest value of the trace along the respective axis. Ignored if orientation is radial.
- Sets the gradient end value. It is given as the absolute position on the axis determined by the orientation. E.g., if orientation is horizontal, the gradient will be horizontal and end at the x-position given by end. If omitted, the gradient ends at the highest value of the trace along the respective axis. Ignored if orientation is radial.
- Sets the type/orientation of the color gradient for the fill. Defaults to none.
- When there is no colorscale sets the color of background pattern fill. Defaults to a
marker.colorbackground whenfillmodeis overlay. Otherwise, defaults to a transparent background. - Sets the source reference on Chart Studio Cloud for
bgcolor. - When there is no colorscale sets the color of foreground pattern fill. Defaults to a
marker.colorbackground whenfillmodeis replace. Otherwise, defaults to dark grey or white to increase contrast with thebgcolor. - Sets the source reference on Chart Studio Cloud for
fgcolor. - Sets the opacity of the foreground pattern fill. Defaults to a 0.5 when
fillmodeis overlay. Otherwise, defaults to 1. - Determines whether
marker.colorshould be used as a default tobgcoloror afgcolor. - Sets the shape of the pattern fill. By default, no pattern is used for filling the area.
- Sets the source reference on Chart Studio Cloud for
shape. - Sets the size of unit squares of the pattern fill in pixels, which corresponds to the interval of repetition of the pattern.
- Sets the source reference on Chart Studio Cloud for
size. - Sets the solidity of the pattern fill. Solidity is roughly the fraction of the area filled by the pattern. Solidity of 0 shows only the background color without pattern and solidty of 1 shows only the foreground color without pattern.
- Sets the source reference on Chart Studio Cloud for
solidity. - Only relevant when
stackgroupis used, and only the firstgroupnormfound in thestackgroupwill be used - including ifvisibleis legendonly but not if it isfalse. Sets the normalization for the sum of thisstackgroup. With fraction, the value of each trace at each location is divided by the sum of all trace values at that location. percent is the same but multiplied by 100 to show percentages. If there are multiple subplots, or multiplestackgroups on one subplot, each will be normalized within its own set. - Determines which trace information appear on hover. If
noneorskipare set, no information is displayed upon hovering. But, ifnoneis set, click and hover events are still fired. - Sets the source reference on Chart Studio Cloud for
hoverinfo. - Sets the horizontal alignment of the text content within hover label box. Has an effect only if the hover label text spans more two or more lines
- Sets the source reference on Chart Studio Cloud for
align. - Sets the background color of the hover labels for this trace
- Sets the source reference on Chart Studio Cloud for
bgcolor. - Sets the border color of the hover labels for this trace.
- Sets the source reference on Chart Studio Cloud for
bordercolor. - Sets the source reference on Chart Studio Cloud for
color. - HTML font family - the typeface that will be applied by the web browser. The web browser can only apply a font if it is available on the system where it runs. Provide multiple font families, separated by commas, to indicate the order in which to apply fonts if they aren't available.
- Sets the source reference on Chart Studio Cloud for
family. - Sets the kind of decoration line(s) with text, such as an under, over or through as well as combinations e.g. under+over, etc.
- Sets the source reference on Chart Studio Cloud for
lineposition. - Sets the shape and color of the shadow behind text. auto places minimal shadow and applies contrast text font color. See https://developer.mozilla.org/en-US/docs/Web/CSS/text-shadow for additional options.
- Sets the source reference on Chart Studio Cloud for
shadow. - Sets the source reference on Chart Studio Cloud for
size. - Sets whether a font should be styled with a normal or italic face from its family.
- Sets the source reference on Chart Studio Cloud for
style. - Sets capitalization of text. It can be used to make text appear in all-uppercase or all-lowercase, or with each word capitalized.
- Sets the source reference on Chart Studio Cloud for
textcase. - Sets the variant of the font.
- Sets the source reference on Chart Studio Cloud for
variant. - Sets the weight (or boldness) of the font.
- Sets the source reference on Chart Studio Cloud for
weight. - Sets the default length (in number of characters) of the trace name in the hover labels for all traces. -1 shows the whole name regardless of length. 0-3 shows the first 0-3 characters, and an integer >3 will show the whole name if it is less than that many characters, but if it is longer, will truncate to
namelength - 3characters and add an ellipsis. - Sets the source reference on Chart Studio Cloud for
namelength. - Do the hover effects highlight individual points (markers or line points) or do they highlight filled regions? If the fill is toself or tonext and there are no markers or text, then the default is fills, otherwise it is points.
- Template string used for rendering the information that appear on hover box. Note that this will override
hoverinfo. Variables are inserted using %{variable}, for example "y: %{y}" as well as %{xother}, {%xother}, {%_xother}, {%xother_}. When showing info for several points, xother will be added to those with different x positions from the first point. An underscore before or after (x|y)other will add a space on that side, only when this field is shown. Numbers are formatted using d3-format's syntax %{variable:d3-format}, for example "Price: %{y:$.2f}". https://github.com/d3/d3-format/tree/v1.4.5#d3-format for details on the formatting syntax. Dates are formatted using d3-time-format's syntax %{variable|d3-time-format}, for example "Day: %{2019-01-01|%A}". https://github.com/d3/d3-time-format/tree/v2.2.3#locale_format for details on the date formatting syntax. The variables available inhovertemplateare the ones emitted as event data described at this link https://plotly.com/javascript/plotlyjs-events/#event-data. Additionally, every attributes that can be specified per-point (the ones that arearrayOk: true) are available. Anything contained in tag<extra>is displayed in the secondary box, for example "{fullData.name} ". To hide the secondary box completely, use an empty tag<extra></extra>. - Sets the source reference on Chart Studio Cloud for
hovertemplate. - Sets hover text elements associated with each (x,y) pair. If a single string, the same string appears over all the data points. If an array of string, the items are mapped in order to the this trace's (x,y) coordinates. To be seen, trace
hoverinfomust contain a text flag. - Sets the source reference on Chart Studio Cloud for
hovertext. - Assigns id labels to each datum. These ids for object constancy of data points during animation. Should be an array of strings, not numbers or any other type.
- Sets the source reference on Chart Studio Cloud for
ids. - Sets the reference to a legend to show this trace in. References to these legends are legend, legend2, legend3, etc. Settings for these legends are set in the layout, under
layout.legend,layout.legend2, etc. - Sets the legend group for this trace. Traces and shapes part of the same legend group hide/show at the same time when toggling legend items.
- HTML font family - the typeface that will be applied by the web browser. The web browser can only apply a font if it is available on the system where it runs. Provide multiple font families, separated by commas, to indicate the order in which to apply fonts if they aren't available.
- Sets the kind of decoration line(s) with text, such as an under, over or through as well as combinations e.g. under+over, etc.
- Sets the shape and color of the shadow behind text. auto places minimal shadow and applies contrast text font color. See https://developer.mozilla.org/en-US/docs/Web/CSS/text-shadow for additional options.
- Sets whether a font should be styled with a normal or italic face from its family.
- Sets capitalization of text. It can be used to make text appear in all-uppercase or all-lowercase, or with each word capitalized.
- Sets the variant of the font.
- Sets the weight (or boldness) of the font.
- Sets the title of the legend group.
- Sets the legend rank for this trace. Items and groups with smaller ranks are presented on top/left side while with reversed
legend.traceorderthey are on bottom/right side. The default legendrank is 1000, so that you can use ranks less than 1000 to place certain items before all unranked items, and ranks greater than 1000 to go after all unranked items. When having unranked or equal rank items shapes would be displayed after traces i.e. according to their order in data and layout. - Sets the width (in px or fraction) of the legend for this trace.
- Sets the line back off from the end point of the nth line segment (in px). This option is useful e.g. to avoid overlap with arrowhead markers. With auto the lines would trim before markers if
marker.anglerefis set to previous. - Sets the source reference on Chart Studio Cloud for
backoff. - Sets the line color.
- Sets the dash style of lines. Set to a dash type string (solid, dot, dash, longdash, dashdot, or longdashdot) or a dash length list in px (eg 5px,10px,2px,2px).
- Determines the line shape. With spline the lines are drawn using spline interpolation. The other available values correspond to step-wise line shapes.
- Simplifies lines by removing nearly-collinear points. When transitioning lines, it may be desirable to disable this so that the number of points along the resulting SVG path is unaffected.
- Has an effect only if
shapeis set to spline Sets the amount of smoothing. 0 corresponds to no smoothing (equivalent to a linear shape). - Sets the line width (in px).
- Sets the marker angle in respect to
angleref. - Sets the reference for marker angle. With previous, angle 0 points along the line from the previous point to this one. With up, angle 0 points toward the top of the screen.
- Sets the source reference on Chart Studio Cloud for
angle. - Determines whether the colorscale is a default palette (
autocolorscale: true) or the palette determined bymarker.colorscale. Has an effect only if inmarker.coloris set to a numerical array. In casecolorscaleis unspecified orautocolorscaleis true, the default palette will be chosen according to whether numbers in thecolorarray are all positive, all negative or mixed. - Determines whether or not the color domain is computed with respect to the input data (here in
marker.color) or the bounds set inmarker.cminandmarker.cmaxHas an effect only if inmarker.coloris set to a numerical array. Defaults tofalsewhenmarker.cminandmarker.cmaxare set by the user. - Sets the upper bound of the color domain. Has an effect only if in
marker.coloris set to a numerical array. Value should have the same units as inmarker.colorand if set,marker.cminmust be set as well. - Sets the mid-point of the color domain by scaling
marker.cminand/ormarker.cmaxto be equidistant to this point. Has an effect only if inmarker.coloris set to a numerical array. Value should have the same units as inmarker.color. Has no effect whenmarker.cautoisfalse. - Sets the lower bound of the color domain. Has an effect only if in
marker.coloris set to a numerical array. Value should have the same units as inmarker.colorand if set,marker.cmaxmust be set as well. - Sets the marker color. It accepts either a specific color or an array of numbers that are mapped to the colorscale relative to the max and min values of the array or relative to
marker.cminandmarker.cmaxif set. - Sets a reference to a shared color axis. References to these shared color axes are coloraxis, coloraxis2, coloraxis3, etc. Settings for these shared color axes are set in the layout, under
layout.coloraxis,layout.coloraxis2, etc. Note that multiple color scales can be linked to the same color axis. - Sets the color of padded area.
- Sets the axis line color.
- Sets the width (in px) or the border enclosing this color bar.
- Determines a formatting rule for the tick exponents. For example, consider the number 1,000,000,000. If none, it appears as 1,000,000,000. If e, 1e+9. If E, 1E+9. If power, 1x10^9 (with 9 in a super script). If SI, 1G. If B, 1B.
- Sets the length of the color bar This measure excludes the padding of both ends. That is, the color bar length is this length minus the padding on both ends.
- Determines whether this color bar's length (i.e. the measure in the color variation direction) is set in units of plot fraction or in *pixels. Use
lento set the value. - Hide SI prefix for 10^n if |n| is below this number. This only has an effect when
tickformatis SI or B. - Specifies the maximum number of ticks for the particular axis. The actual number of ticks will be chosen automatically to be less than or equal to
nticks. Has an effect only iftickmodeis set to auto. - Sets the orientation of the colorbar.
- Sets the axis line color.
- Sets the width (in px) of the axis line.
- If "true", even 4-digit integers are separated
- If all, all exponents are shown besides their significands. If first, only the exponent of the first tick is shown. If last, only the exponent of the last tick is shown. If none, no exponents appear.
- Determines whether or not the tick labels are drawn.
- If all, all tick labels are displayed with a prefix. If first, only the first tick is displayed with a prefix. If last, only the last tick is displayed with a suffix. If none, tick prefixes are hidden.
- Same as
showtickprefixbut for tick suffixes. - Sets the thickness of the color bar This measure excludes the size of the padding, ticks and labels.
- Determines whether this color bar's thickness (i.e. the measure in the constant color direction) is set in units of plot fraction or in pixels. Use
thicknessto set the value. - Sets the angle of the tick labels with respect to the horizontal. For example, a
tickangleof -90 draws the tick labels vertically. - Sets the tick color.
- HTML font family - the typeface that will be applied by the web browser. The web browser can only apply a font if it is available on the system where it runs. Provide multiple font families, separated by commas, to indicate the order in which to apply fonts if they aren't available.
- Sets the kind of decoration line(s) with text, such as an under, over or through as well as combinations e.g. under+over, etc.
- Sets the shape and color of the shadow behind text. auto places minimal shadow and applies contrast text font color. See https://developer.mozilla.org/en-US/docs/Web/CSS/text-shadow for additional options.
- Sets whether a font should be styled with a normal or italic face from its family.
- Sets capitalization of text. It can be used to make text appear in all-uppercase or all-lowercase, or with each word capitalized.
- Sets the variant of the font.
- Sets the weight (or boldness) of the font.
- Sets the tick label formatting rule using d3 formatting mini-languages which are very similar to those in Python. For numbers, see: https://github.com/d3/d3-format/tree/v1.4.5#d3-format. And for dates see: https://github.com/d3/d3-time-format/tree/v2.2.3#locale_format. We add two items to d3's date formatter: %h for half of the year as a decimal number as well as %{n}f for fractional seconds with n digits. For example, 2016-10-13 09:15:23.456 with tickformat %H~%M~%S.%2f would display 09~15~23.46
- Determines how we handle tick labels that would overflow either the graph div or the domain of the axis. The default value for inside tick labels is hide past domain. In other cases the default is hide past div.
- Determines where tick labels are drawn relative to the ticks. Left and right options are used when
orientationis h, top and bottom whenorientationis v. - Sets the spacing between tick labels as compared to the spacing between ticks. A value of 1 (default) means each tick gets a label. A value of 2 means shows every 2nd label. A larger value n means only every nth tick is labeled.
tick0determines which labels are shown. Not implemented for axes withtypelog or multicategory, or whentickmodeis array. - Sets the tick length (in px).
- Sets the tick mode for this axis. If auto, the number of ticks is set via
nticks. If linear, the placement of the ticks is determined by a starting positiontick0and a tick stepdtick(linear is the default value iftick0anddtickare provided). If array, the placement of the ticks is set viatickvalsand the tick text isticktext. (array is the default value iftickvalsis provided). - Sets a tick label prefix.
- Determines whether ticks are drawn or not. If , this axis' ticks are not drawn. If outside (inside), this axis' are drawn outside (inside) the axis lines.
- Sets a tick label suffix.
- Sets the text displayed at the ticks position via
tickvals. Only has an effect iftickmodeis set to array. Used withtickvals. - Sets the source reference on Chart Studio Cloud for
ticktext. - Sets the values at which ticks on this axis appear. Only has an effect if
tickmodeis set to array. Used withticktext. - Sets the source reference on Chart Studio Cloud for
tickvals. - Sets the tick width (in px).
- HTML font family - the typeface that will be applied by the web browser. The web browser can only apply a font if it is available on the system where it runs. Provide multiple font families, separated by commas, to indicate the order in which to apply fonts if they aren't available.
- Sets the kind of decoration line(s) with text, such as an under, over or through as well as combinations e.g. under+over, etc.
- Sets the shape and color of the shadow behind text. auto places minimal shadow and applies contrast text font color. See https://developer.mozilla.org/en-US/docs/Web/CSS/text-shadow for additional options.
- Sets whether a font should be styled with a normal or italic face from its family.
- Sets capitalization of text. It can be used to make text appear in all-uppercase or all-lowercase, or with each word capitalized.
- Sets the variant of the font.
- Sets the weight (or boldness) of the font.
- Determines the location of color bar's title with respect to the color bar. Defaults to top when
orientationif v and defaults to right whenorientationif h. - Sets the title of the color bar.
- Sets the x position with respect to
xrefof the color bar (in plot fraction). Whenxrefis paper, defaults to 1.02 whenorientationis v and 0.5 whenorientationis h. Whenxrefis container, defaults to 1 whenorientationis v and 0.5 whenorientationis h. Must be between 0 and 1 ifxrefis container and between -2 and 3 ifxrefis paper. - Sets this color bar's horizontal position anchor. This anchor binds the
xposition to the left, center or right of the color bar. Defaults to left whenorientationis v and center whenorientationis h. - Sets the amount of padding (in px) along the x direction.
- Sets the container
xrefers to. container spans the entirewidthof the plot. paper refers to the width of the plotting area only. - Sets the y position with respect to
yrefof the color bar (in plot fraction). Whenyrefis paper, defaults to 0.5 whenorientationis v and 1.02 whenorientationis h. Whenyrefis container, defaults to 0.5 whenorientationis v and 1 whenorientationis h. Must be between 0 and 1 ifyrefis container and between -2 and 3 ifyrefis paper. - Sets this color bar's vertical position anchor This anchor binds the
yposition to the top, middle or bottom of the color bar. Defaults to middle whenorientationis v and bottom whenorientationis h. - Sets the amount of padding (in px) along the y direction.
- Sets the container
yrefers to. container spans the entireheightof the plot. paper refers to the height of the plotting area only. - Sets the colorscale. Has an effect only if in
marker.coloris set to a numerical array. The colorscale must be an array containing arrays mapping a normalized value to an rgb, rgba, hex, hsl, hsv, or named color string. At minimum, a mapping for the lowest (0) and highest (1) values are required. For example,[[0, 'rgb(0,0,255)'], [1, 'rgb(255,0,0)']]. To control the bounds of the colorscale in color space, usemarker.cminandmarker.cmax. Alternatively,colorscalemay be a palette name string of the following list: Blackbody,Bluered,Blues,Cividis,Earth,Electric,Greens,Greys,Hot,Jet,Picnic,Portland,Rainbow,RdBu,Reds,Viridis,YlGnBu,YlOrRd. - Sets the source reference on Chart Studio Cloud for
color. - Sets the final color of the gradient fill: the center color for radial, the right for horizontal, or the bottom for vertical.
- Sets the source reference on Chart Studio Cloud for
color. - Sets the type of gradient used to fill the markers
- Sets the source reference on Chart Studio Cloud for
type. - Determines whether the colorscale is a default palette (
autocolorscale: true) or the palette determined bymarker.line.colorscale. Has an effect only if inmarker.line.coloris set to a numerical array. In casecolorscaleis unspecified orautocolorscaleis true, the default palette will be chosen according to whether numbers in thecolorarray are all positive, all negative or mixed. - Determines whether or not the color domain is computed with respect to the input data (here in
marker.line.color) or the bounds set inmarker.line.cminandmarker.line.cmaxHas an effect only if inmarker.line.coloris set to a numerical array. Defaults tofalsewhenmarker.line.cminandmarker.line.cmaxare set by the user. - Sets the upper bound of the color domain. Has an effect only if in
marker.line.coloris set to a numerical array. Value should have the same units as inmarker.line.colorand if set,marker.line.cminmust be set as well. - Sets the mid-point of the color domain by scaling
marker.line.cminand/ormarker.line.cmaxto be equidistant to this point. Has an effect only if inmarker.line.coloris set to a numerical array. Value should have the same units as inmarker.line.color. Has no effect whenmarker.line.cautoisfalse. - Sets the lower bound of the color domain. Has an effect only if in
marker.line.coloris set to a numerical array. Value should have the same units as inmarker.line.colorand if set,marker.line.cmaxmust be set as well. - Sets the marker.line color. It accepts either a specific color or an array of numbers that are mapped to the colorscale relative to the max and min values of the array or relative to
marker.line.cminandmarker.line.cmaxif set. - Sets a reference to a shared color axis. References to these shared color axes are coloraxis, coloraxis2, coloraxis3, etc. Settings for these shared color axes are set in the layout, under
layout.coloraxis,layout.coloraxis2, etc. Note that multiple color scales can be linked to the same color axis. - Sets the colorscale. Has an effect only if in
marker.line.coloris set to a numerical array. The colorscale must be an array containing arrays mapping a normalized value to an rgb, rgba, hex, hsl, hsv, or named color string. At minimum, a mapping for the lowest (0) and highest (1) values are required. For example,[[0, 'rgb(0,0,255)'], [1, 'rgb(255,0,0)']]. To control the bounds of the colorscale in color space, usemarker.line.cminandmarker.line.cmax. Alternatively,colorscalemay be a palette name string of the following list: Blackbody,Bluered,Blues,Cividis,Earth,Electric,Greens,Greys,Hot,Jet,Picnic,Portland,Rainbow,RdBu,Reds,Viridis,YlGnBu,YlOrRd. - Sets the source reference on Chart Studio Cloud for
color. - Reverses the color mapping if true. Has an effect only if in
marker.line.coloris set to a numerical array. If true,marker.line.cminwill correspond to the last color in the array andmarker.line.cmaxwill correspond to the first color. - Sets the width (in px) of the lines bounding the marker points.
- Sets the source reference on Chart Studio Cloud for
width. - Sets a maximum number of points to be drawn on the graph. 0 corresponds to no limit.
- Sets the marker opacity.
- Sets the source reference on Chart Studio Cloud for
opacity. - Reverses the color mapping if true. Has an effect only if in
marker.coloris set to a numerical array. If true,marker.cminwill correspond to the last color in the array andmarker.cmaxwill correspond to the first color. - Determines whether or not a colorbar is displayed for this trace. Has an effect only if in
marker.coloris set to a numerical array. - Sets the marker size (in px).
- Has an effect only if
marker.sizeis set to a numerical array. Sets the minimum size (in px) of the rendered marker points. - Has an effect only if
marker.sizeis set to a numerical array. Sets the rule for which the data insizeis converted to pixels. - Has an effect only if
marker.sizeis set to a numerical array. Sets the scale factor used to determine the rendered size of marker points. Use withsizeminandsizemode. - Sets the source reference on Chart Studio Cloud for
size. - Moves the marker away from the data point in the direction of
angle(in px). This can be useful for example if you have another marker at this location and you want to point an arrowhead marker at it. - Sets the source reference on Chart Studio Cloud for
standoff. - Sets the marker symbol type. Adding 100 is equivalent to appending -open to a symbol name. Adding 200 is equivalent to appending -dot to a symbol name. Adding 300 is equivalent to appending -open-dot or dot-open to a symbol name.
- Sets the source reference on Chart Studio Cloud for
symbol. - Sets the source reference on Chart Studio Cloud for
meta. - Determines the drawing mode for this scatter trace. If the provided
modeincludes text then thetextelements appear at the coordinates. Otherwise, thetextelements appear on hover. If there are less than 20 points and the trace is not stacked then the default is lines+markers. Otherwise, lines. - Sets the trace name. The trace name appears as the legend item and on hover.
- Set several traces linked to the same position axis or matching axes to the same offsetgroup where bars of the same position coordinate will line up.
- Sets the opacity of the trace.
- Only relevant in the following cases: 1. when
scattermodeis set to group. 2. whenstackgroupis used, and only the firstorientationfound in thestackgroupwill be used - including ifvisibleis legendonly but not if it isfalse. Sets the stacking direction. With v (h), the y (x) values of subsequent traces are added. Also affects the default value offill. - Sets the marker color of selected points.
- Sets the marker opacity of selected points.
- Sets the marker size of selected points.
- Sets the text font color of selected points.
- Determines whether or not an item corresponding to this trace is shown in the legend.
- Only relevant when
stackgroupis used, and only the firststackgapsfound in thestackgroupwill be used - including ifvisibleis legendonly but not if it isfalse. Determines how we handle locations at which other traces in this group have data but this one does not. With infer zero we insert a zero at these locations. With interpolate we linearly interpolate between existing values, and extrapolate a constant beyond the existing values. - Set several scatter traces (on the same subplot) to the same stackgroup in order to add their y values (or their x values if
orientationis h). If blank or omitted this trace will not be stacked. Stacking also turnsfillon by default, using tonexty (tonextx) iforientationis h (v) and sets the defaultmodeto lines irrespective of point count. You can only stack on a numeric (linear or log) axis. Traces in astackgroupwill only fill to (or be filled to) other traces in the same group. With multiplestackgroups or some traces stacked and some not, if fill-linked traces are not already consecutive, the later ones will be pushed down in the drawing order. - Sets the maximum number of points to keep on the plots from an incoming stream. If
maxpointsis set to 50, only the newest 50 points will be displayed on the plot. - The stream id number links a data trace on a plot with a stream. See https://chart-studio.plotly.com/settings for more details.
- Sets text elements associated with each (x,y) pair. If a single string, the same string appears over all the data points. If an array of string, the items are mapped in order to the this trace's (x,y) coordinates. If trace
hoverinfocontains a text flag and hovertext is not set, these elements will be seen in the hover labels. - Sets the source reference on Chart Studio Cloud for
color. - HTML font family - the typeface that will be applied by the web browser. The web browser can only apply a font if it is available on the system where it runs. Provide multiple font families, separated by commas, to indicate the order in which to apply fonts if they aren't available.
- Sets the source reference on Chart Studio Cloud for
family. - Sets the kind of decoration line(s) with text, such as an under, over or through as well as combinations e.g. under+over, etc.
- Sets the source reference on Chart Studio Cloud for
lineposition. - Sets the shape and color of the shadow behind text. auto places minimal shadow and applies contrast text font color. See https://developer.mozilla.org/en-US/docs/Web/CSS/text-shadow for additional options.
- Sets the source reference on Chart Studio Cloud for
shadow. - Sets the source reference on Chart Studio Cloud for
size. - Sets whether a font should be styled with a normal or italic face from its family.
- Sets the source reference on Chart Studio Cloud for
style. - Sets capitalization of text. It can be used to make text appear in all-uppercase or all-lowercase, or with each word capitalized.
- Sets the source reference on Chart Studio Cloud for
textcase. - Sets the variant of the font.
- Sets the source reference on Chart Studio Cloud for
variant. - Sets the weight (or boldness) of the font.
- Sets the source reference on Chart Studio Cloud for
weight. - Sets the positions of the
textelements with respects to the (x,y) coordinates. - Sets the source reference on Chart Studio Cloud for
textposition. - Sets the source reference on Chart Studio Cloud for
text. - Template string used for rendering the information text that appear on points. Note that this will override
textinfo. Variables are inserted using %{variable}, for example "y: %{y}". Numbers are formatted using d3-format's syntax %{variable:d3-format}, for example "Price: %{y:$.2f}". https://github.com/d3/d3-format/tree/v1.4.5#d3-format for details on the formatting syntax. Dates are formatted using d3-time-format's syntax %{variable|d3-time-format}, for example "Day: %{2019-01-01|%A}". https://github.com/d3/d3-time-format/tree/v2.2.3#locale_format for details on the date formatting syntax. Every attributes that can be specified per-point (the ones that arearrayOk: true) are available. - Sets the source reference on Chart Studio Cloud for
texttemplate. - Assign an id to this trace, Use this to provide object constancy between traces during animations and transitions.
- Sets the marker color of unselected points, applied only when a selection exists.
- Sets the marker opacity of unselected points, applied only when a selection exists.
- Sets the marker size of unselected points, applied only when a selection exists.
- Sets the text font color of unselected points, applied only when a selection exists.
- Determines whether or not this trace is visible. If legendonly, the trace is not drawn, but can appear as a legend item (provided that the legend itself is visible).
- Sets the x coordinates.
- Sets a reference between this trace's x coordinates and a 2D cartesian x axis. If x (the default value), the x coordinates refer to
layout.xaxis. If x2, the x coordinates refer tolayout.xaxis2, and so on. - Sets the calendar system to use with
xdate data. - Sets the hover text formatting rulefor
xusing d3 formatting mini-languages which are very similar to those in Python. For numbers, see: https://github.com/d3/d3-format/tree/v1.4.5#d3-format. And for dates see: https://github.com/d3/d3-time-format/tree/v2.2.3#locale_format. We add two items to d3's date formatter: %h for half of the year as a decimal number as well as %{n}f for fractional seconds with n digits. For example, 2016-10-13 09:15:23.456 with tickformat %H~%M~%S.%2f would display 09~15~23.46By default the values are formatted usingxaxis.hoverformat. - Only relevant when the axis
typeis date. Sets the alignment of data points on the x axis. - Sets the source reference on Chart Studio Cloud for
x. - Sets the y coordinates.
- Sets a reference between this trace's y coordinates and a 2D cartesian y axis. If y (the default value), the y coordinates refer to
layout.yaxis. If y2, the y coordinates refer tolayout.yaxis2, and so on. - Sets the calendar system to use with
ydate data. - Sets the hover text formatting rulefor
yusing d3 formatting mini-languages which are very similar to those in Python. For numbers, see: https://github.com/d3/d3-format/tree/v1.4.5#d3-format. And for dates see: https://github.com/d3/d3-time-format/tree/v2.2.3#locale_format. We add two items to d3's date formatter: %h for half of the year as a decimal number as well as %{n}f for fractional seconds with n digits. For example, 2016-10-13 09:15:23.456 with tickformat %H~%M~%S.%2f would display 09~15~23.46By default the values are formatted usingyaxis.hoverformat. - Only relevant when the axis
typeis date. Sets the alignment of data points on the y axis. - Sets the source reference on Chart Studio Cloud for
y. - Sets the layer on which this trace is displayed, relative to other SVG traces on the same subplot. SVG traces with higher
zorderappear in front of those with lowerzorder.